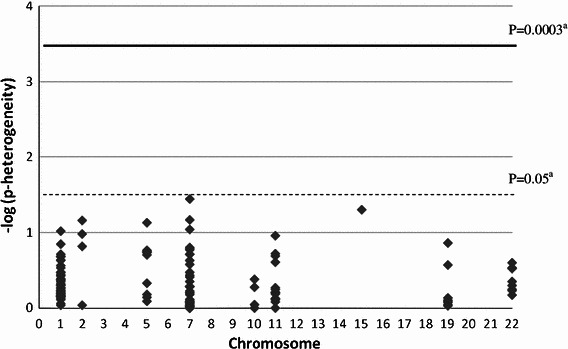
Fig. 2.

Log10 p value for heterogeneity (multivariable-adjusted models) of the association between FAC/FEC treatment regimen and risk of CBC for 180 SNPs. aThe dashed line shows the p value cut-off of 0.05 and the solid line the Bonferroni-corrected p value cut-off of 0.0003
