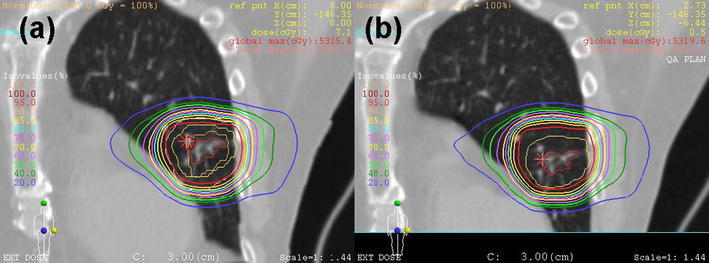
Fig. 4.

Examples of dose distributions for treatment planning (a) and 4D CT confirmation at gate-out (b). Red, yellow, orange, and white targets indicate GTV, CTV, IGTV, and PTV, respectively. The IGTV and PTV are contoured only on the gated CT images (a)
