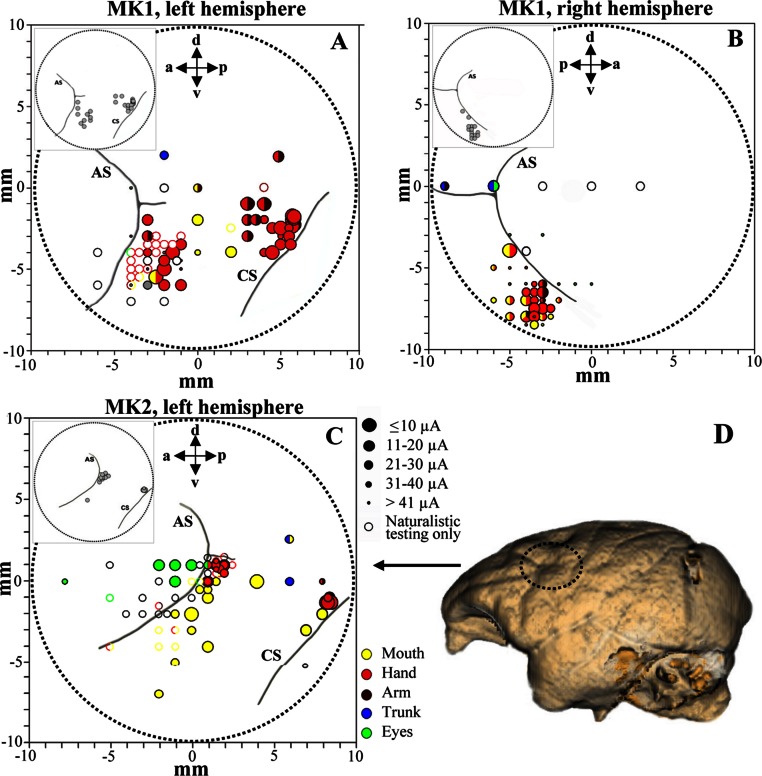
Figure 3. Penetration sites during experiments (A–B, MK1 and C, MK2) and example of brain surface reconstruction based on MRI data (D, MK2).
The top left box represents the selected sites for single-unit recording. Filled symbols indicate movements evoked by ICMS at threshold current level. The size of the circles is correlated with threshold values. Colors refer to the specific movement evoked by ICMS. Unfilled symbols indicate sites not stimulated. AS, arcuate sulcus; CS, central sulcus.

