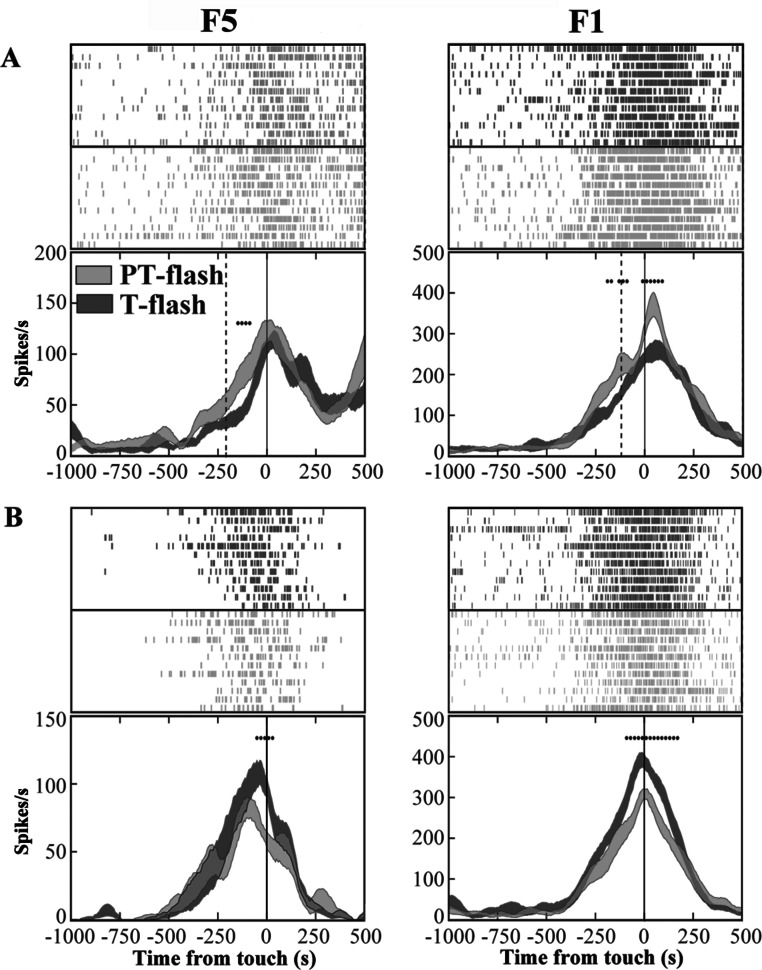
Figure 5. Activity of F5 and F1 motor neurons in PT- and T-flash conditions.
(A) F5 and F1 neurons showing significantly higher SDF in PT-flash condition compared to T-flash condition. (B) F5 and F1 neurons showing significantly higher SDF in T-flash condition compared to PT-flash condition. Rasters and SDF of 12 trials are aligned with respect to object touch. Vertical lines represent touch (full line) or PT-flash delivery (dashed line). *p < 0.05 different from PT-flash condition (running two-tailed paired Student’s t-test).

