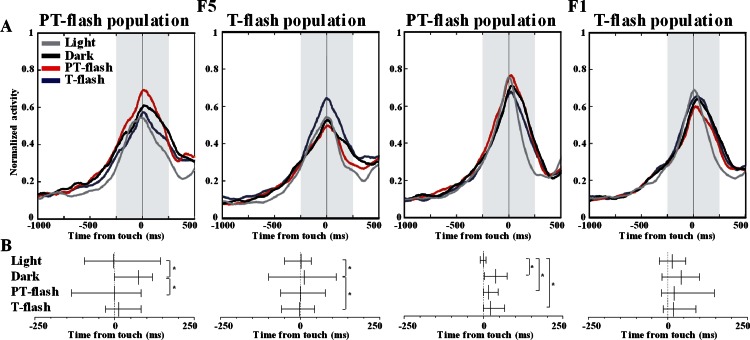
Figure 7. Peak time distribution of PT- and T-flash populations in all conditions.
(A) Average normalized activity of F5 and F1 flash populations. (B) Temporal distribution of peak activity of F5 and F1 flash populations. Vertical dotted lines represent touch. The small vertical line crossing each sample is the median. Whiskers define the inter-quartile-range (IQR). *p < 0.05 different from other conditions (Ansari-Bradley dispersion test).

