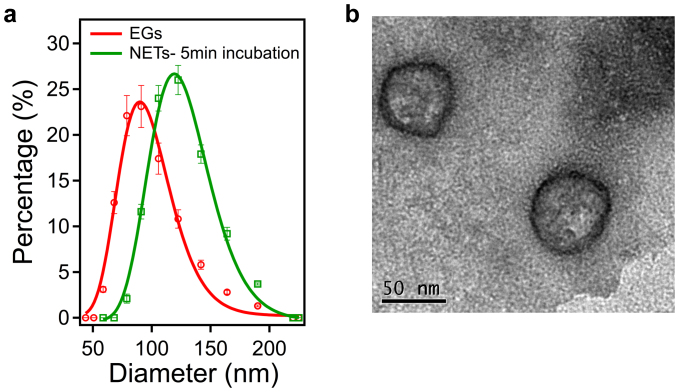
Figure 1. Size distribution profiling and TEM image of NETs.
(a), Diameter distributions of EGs and NETs. Using dynamic light scattering, the ranges of the measured diameters are 58–190 nm for the EGs, and 78–190 nm for the NETs formed after five minutes of incubation in hypotonic solution and PBS containing 215 μM ICG. Each measurement was repeated using at least three samples. We present the mean of each measurement, represented as circles for EGs, and squares for NET. The error bars represent standard deviations from the mean values. We fitted Lognormal functions to the measured diameter distributions (solid curves). The estimated mean diameters, as determined by the Lognormal fits, are 95.26 nm (R2 = 0.97), and 124.61 nm (R2 = 0.98) for EGs and NETs, respectively. (b), Illustrative TEM image of NETs.

