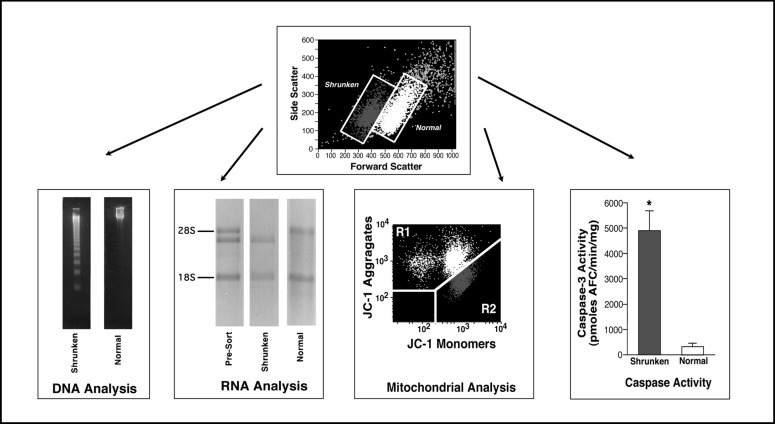
Fig. 2.
Relationship between the apoptotic volume decrease and various characteristics associated with the apoptotic process. Physically sorted normal and shrunken populations of dex treated S49 Neo cells were examined for their DNA integrity by agarose gel eletrophoresis. Shrunken cells showed the presence of degraded DNA in the ladder like pattern of 180 to 200 bp fragments characteristic of apoptosis. In contrast, the normal or non-shrunken population of cells had not degraded their DNA. Specific cleavage of the 28S ribosomal RNA also occurs solely in the shrunken population of cells. Pre-sorted cells show both the intact and cleaved 28S ribosomal RNA, however only the sorted shrunken population of apoptotic cells has the cleaved RNA product, while the normal population of cells has an intact 28S ribosomal band. Furthermore, changes in the mitochondrial membrane potential were restricted to the shrunken, apoptotic cells. When the mitochondrial membrane potential dye (JC-1) is loaded into normal, healthy cells it forms aggregates with a high fluorescent emission in an aggregate state, shown as the light population of cells. When the mitochondrial membrane potential is lost, these aggregates form monomers, thus a loss of the aggregate fluorescence and an increase in the monomeric fluorescence is observed, shown as the dark population of cells. When this change in mitochondrial membrane potential is compared to the change in cell size, the shrunken, apoptotic cells have a decrease in the aggregate fluorescence and an increase in the monomeric fluorescence, suggesting that only the shrunken population of cells have lost their mitochondrial membrane potential. Finally, physically sorting the normal and shrunken cells and individually examining these cell populations for caspase activity using a fluorometric caspase assay again showed that an increase in caspase-3-like activity was restricted to the shrunken cells.

