Fig. 2.
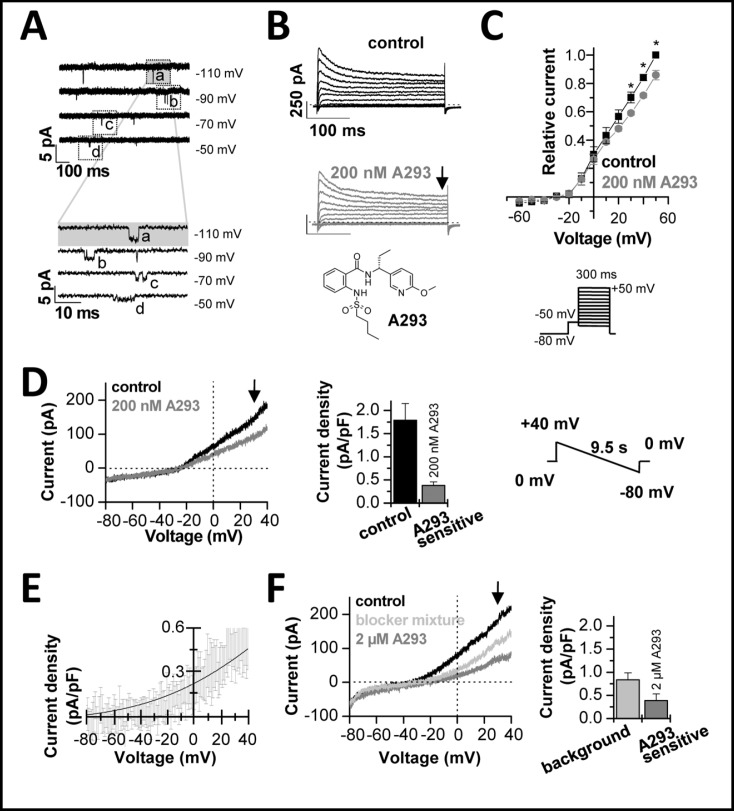
Electrophysiological characterization of human cardiac ITASK-1. (A), Cell attached recordings from a TASK-1 like channel in human atrial cardiomyocytes. The lower panel shows a magnification of the events designated in the top panel by dotted squares. (B), Representative current traces elicited by the voltage protocol illustrated in panel C. After a pre-step of 70 ms to −50 mV, the voltage was stepped for 300 ms from −60 mV to +50 mV in 10 mV increments. The holding potential was −80 mV and the sweep time interval was 10 s. Control traces are shown in black and traces after administration of 200 nM A293 in grey. The chemical structure of A293 is illustrated below. (C), Mean current voltage relationships in the absence and presence of A293 derived at the end of the 300 ms test pulse (as indicated by the arrow in panel B). Significance was analyzed using a paired Student's t-test. (D), Isolation of the A293-sensitive TASK-1 current, using 200 nM A293. Currents were recorded using the shown voltage ramps from +40 mV to −80 mV (duration 9.5 s) from a holding potential of 0 mV. Control traces are shown in black. The bar graph in the middle panel analyzes the currents measured at +30 mV (as illustrated by the arrow) and the difference current analyzed after application of the TASK blocker A293 (which corresponds to ITASK-1). (E), Depicted is the average difference current with S.E.M., isolated with 200 nM A293 (n = 7). The solid line indicates a fit to the GHK equation. (F), Recordings of a background conductance after application of a blocker mixture (light grey), using the same protocols and analysis as described above. 2 µM A293 (in the presence of the blocker mixture) was used to isolate the A293-sensitive TASK-1 currents and the relative contribution to the background current.

