Fig. 4.
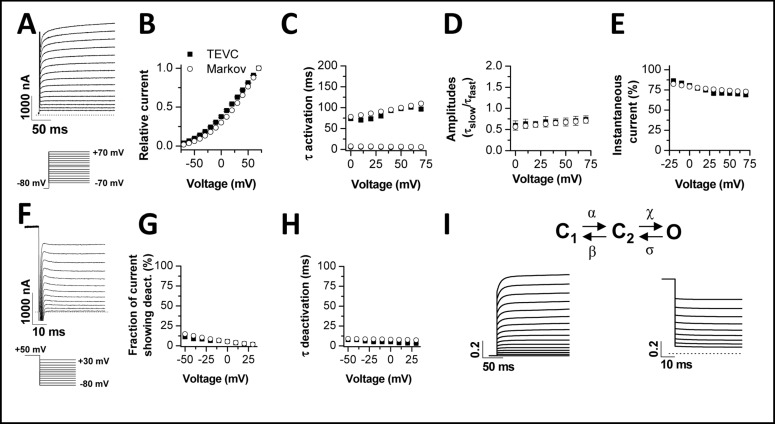
Development of a TASK-1 Markov model. TEVC measurements of TASK-1 channels in Xenopus oocytes served to create a Markov model based on a closed-closed-open assumption. The figure illustrates the comparison of biophysical parameters of TASK-1 injected oocytes measured by TEVC (squares) and the Markov model (circles). (A), Representative TASK-1 current voltage relationship recordings elicited by the voltage protocol illustrated. The recordings in (A) served as input for the comparison of TASK-1 model data with TEVC recordings (B-E). (B), Current voltage relationship. (C), Time constants of activation. (D), Ratio of the amplitudes of the time constants of activation. (E), Percentage of instantaneous current. (F), Representative recordings of TASK-1 deactivation, using the illustrated voltage protocol. The recordings in (F) served as input for the comparison to the TASK-1 model data (G-H). (G), Fraction of current showing deactivation. (H), Time constant of deactivation. (I), Scheme of the Markov model with simulated currents for activation (left) and deactivation (right). Currents were normalized.

