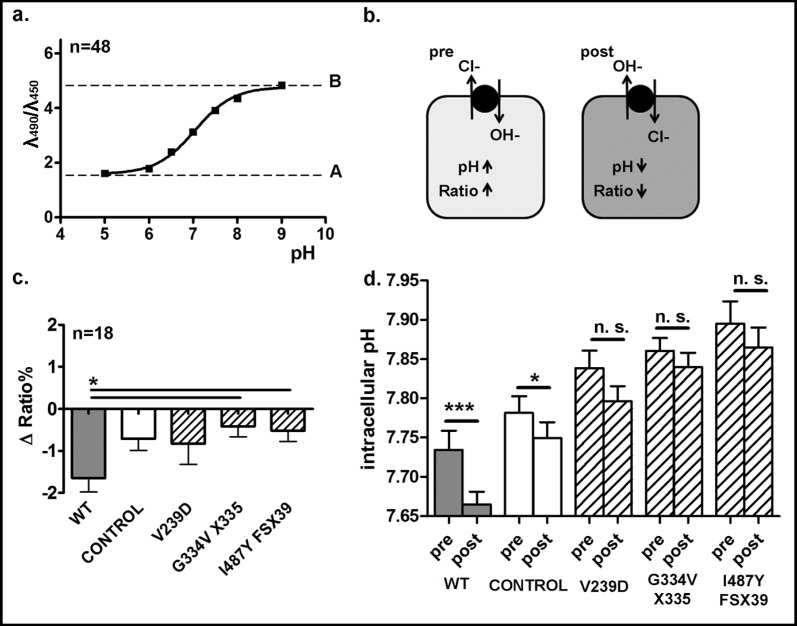
Fig. 3.
Cl−/OH− exchange activity of WT pendrin and the mutants V239D, G334V X335 and I487Y FSX39. a, Titration curve of the intracellular pH determined in non-transfected HEK293 Phoenix cells loaded with BCECF-AM 1 µM maintained in solutions containing 150 mM K+ and 10 µM nigericin at the pH of 5.0, 6.0, 6.5, 7.0, 7.5, 8.0 and 9.0. n indicates the number of independent samples, collected over 4 experimental days. b, Cells transfected with WT or mutated pendrin or with the pTARGET empty vector as a control were loaded with BCECF-AM 1 µM and bathed for 30 min in a bicarbonate-free, low chloride solution (pre) and then exposed to a high chloride solution (post). Fluorescence emissions at 535 nm following excitation at 450 and 490 nm were measured over time, subtracted for their respective backgrounds and expressed as ratios. c, Percentage of fluorescence decrease (Δ Ratio%) determined over the experimental period (107 sec). n indicates the number of independent samples, collected over three experimental days. *: p<0.05, one way ANOVA with Bonferroni's post-test. d, The ratios values were interpolated on the calibration curve shown in a, to determine the intracellular pH before and after exposure of cells to chloride. ***: p<0.001, *: p<0.05, n. s.: not statistically significant, paired Students t-test. The number of experiment is the same as in c.

