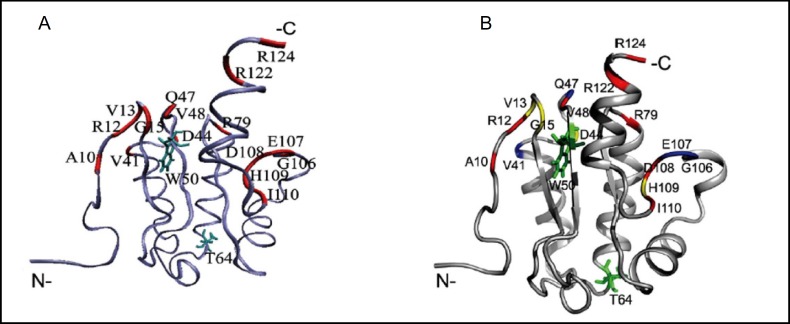
Fig. 5.
A. M. tuberculosis Rv1739c STAS domain backbone structure (blue) with red-highlighted amino acid residues that showed significant chemical shift perturbation (CSP) in the presence of GDP. Side chains of residues W50 and T64 are in cyan. Figure drawn in VMD [74]. B. Rv1739c STAS residues showing GDP-induced CSP mapped onto average STAS structure. Colors denote STAS backbone 15N-1H relaxation parameters. CSP residues in red show increased R2 and J(0) along with decreased NOE and J(<&N) values, indicating high flexibility likely due to increased chemical exchange. CSP residues in yellow deviated from the red pattern in one or two relaxation parameters. CSP residues in blue are those for which at least two relaxation parameters were unavailable due to experimental limitations. W50 and T64 are shown in green. Figure drawn in PyMOL (www.pymol.org). Modified from [30] and from Sharma et al. (manuscript in revision).

