
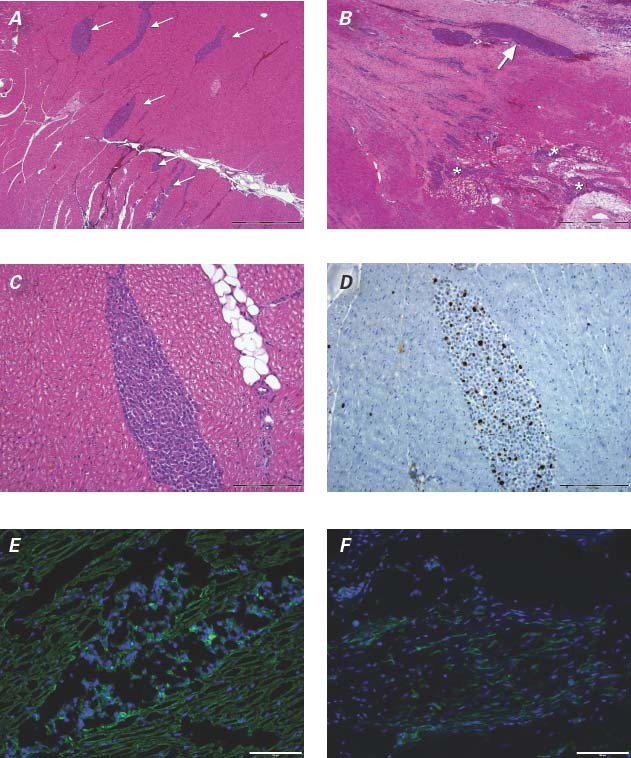
Fig. 4 The distribution pattern of mesenchymal precursor stem cells (MPCs) after NOGA-guided delivery. Photomicrographs of histologic sections from sheep in the acute group showing A) multiple MPC clusters (arrows) in the myocardium (H & E, orig. ×4) and B) a large, linear MPC cluster at the myocardial infarct border (arrow). A more disseminated, infiltrative pattern is observed at the bot-tom right of the section (asterisks) (H & E, orig. ×4). C) Higher power magnification of an MPC cluster in an H & E-stained section (orig. ×20) from a sheep in the acute group and D) its corresponding Ki-67-stained section (orig. ×20). E) DAPI-positive MPCs seen (in blue) in a cluster formation in the center of the image and infiltrating the interstitium of the adjacent myocardium in a sheep in the acute group (α-actinin [green], orig. ×20). F) DAPI-positive MPCs observed (in blue) within the organizing infarct of a sheep in the chronic group (α-smooth muscle actin [green], orig. ×20).
Bar = 1 mm in A and B, 200 μm in C and D, 100 μm in E and F; DAPI = 4′,6-diamidino-2 phenylindole dihydrochloride