
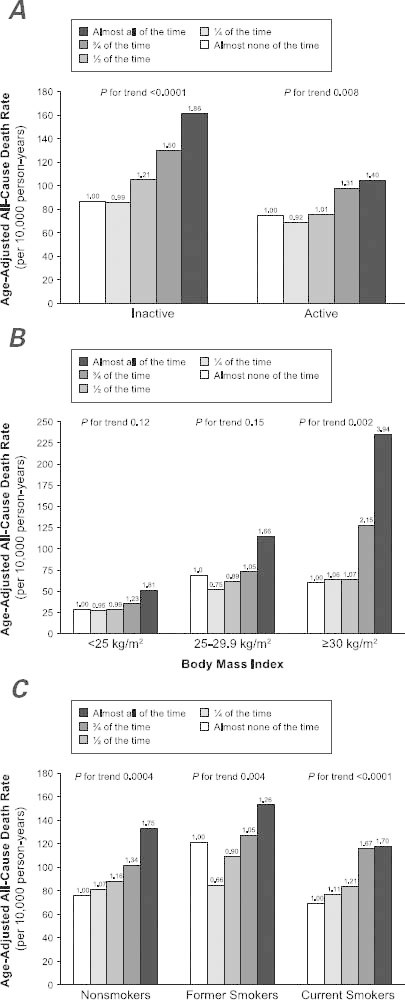
Fig. 2 Age-adjusted all-cause death rates across categories of daily sitting time in subgroups defined by A) leisure-time physical activity (active defined as ≥7.5 METċhrċwk−1), B) body mass index (BMI), and C) smoking status in 17,013 men and women from the Canada Fitness Survey, 1981–1993. The height of the bars indicates the mortality rates, and the numbers atop the bars are the hazard ratios from the proportional hazards regression. The sample size for body mass index was 10,477.
Reproduced with permission from Wolters Kluwer Health (Katzmarzyk Medicine & Science in Sports & Exercise, 2009).7