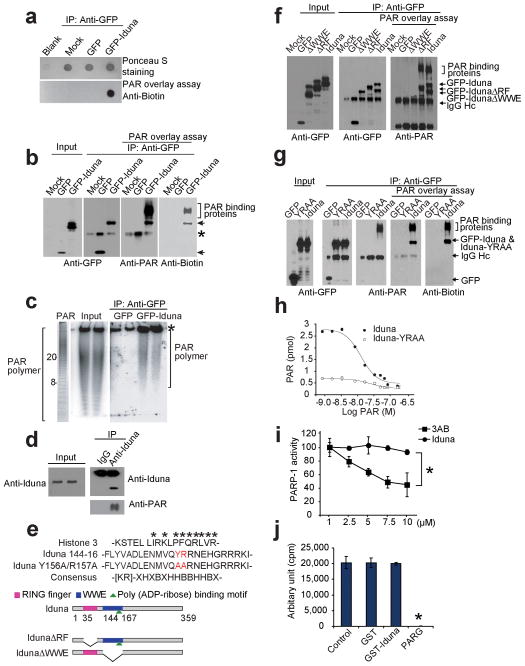
Figure 3.
PAR binding activity of Iduna. (a) Dot blot of immunoprecipitated GFP-Iduna and GFP with biotin-labeled PAR polymer and detected with anti-biotin antibody. Data were reproduced with similar results. (b) Far western analysis of Iduna PAR binding activity. Arrows indicate GFP-Iduna fusion protein and bracket indicates PAR binding proteins. Asterisk indicates a IgG heavy chain signal recognized by polyclonal antibodies including the GFP or PAR antibodies. Data were reproduced with similar results. (c) [32P]-PAR polymer bound to GFP-Iduna or GFP analyzed in Trisborate-EDTA PAGE. Values represent ADP-ribose units in the PAR polymer. Asterisk indicates non-specific PAR polymer binding. (d) Immunoblot of endogenous Iduna and PAR from cortical neurons treated with 50 μM NMDA. These experiments were repeated at least two times with similar results. (e) Alignment of the PAR binding motif in Iduna and Histone 3. The Iduna Y156A/R157A PAR binding mutant (red) is indicated. Schematic of Iduna functional domains and deletion mutants. Ring finger (RF) domain (AA 35–77) [pink bar], WWE domain (AA 91–167) [blue bar] and the PAR binding domain (144–167) [green triangle] are highlighted. Full-length Iduna, and RF (IdunaΔRF) and WWE (IdunaΔWWE) domain deletion mutants of Iduna are shown. (f) Far western analysis of PAR binding activity of Iduna and Iduna deletion mutants. Arrows indicate GFP-Iduna fusion proteins and bracket indicates PAR binding proteins. IgG heavy chain (IgG Hc) is indicated by arrow. n=2 (g) Far western analysis of PAR binding activity of Iduna and Iduna-YRRA mutant. Arrows indicate GFP-Iduna fusion proteins and bracket indicates PAR binding proteins. (h) Analysis of PAR binding properties of wild type Iduna (●) and Iduna-YRAA mutant (○). (i) Chemiluminescent activity of PARP-1 in the presence of Iduna or the PARP-1 inhibitor 3-aminobenzamide (3-AB). Data represent two separate experiments. *p < 0.05 (j) Quantification of [32P]-PAR polymers synthesized by PARP-1 in the presence of GST, GST-Iduna or PARG (which catalytically degrades PAR), respectively. Data represent mean ± SEM, n=3 *p < 0.05 by ANOVA with Tukey-Kramer’s posthoc test.

