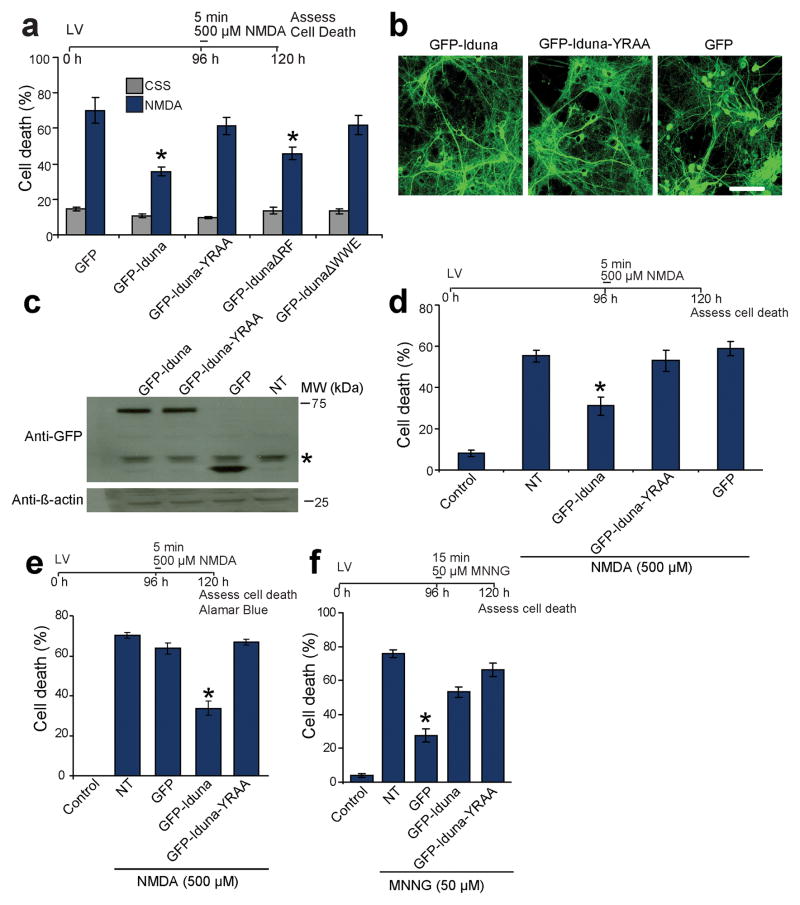
Figure 4.
PAR-binding property of Iduna mediates neuroprotection. (a) Quantification of 500 μM NMDA induced cell death in primary cortical neurons transciently transfected to express GFP, GFP-Iduna, GFP-Iduna-YRAA, GFP-IdunaΔRF or GFP-IdunaΔWWE. Cells with fragmented processes were considered dead. Data represent mean ± SEM, n=6 from two independent experiments, *p < 0.05 by ANOVA with Tukey-Kramer’s posthoc test. (b) Representative photomicrographs of lentiviral expression of GFP, GFP-Iduna or GFP-Iduna-YRAA in primary cortical neurons. n=4, scale bar = 50 μm (c) Immunoblots of lentiviral expression of GFP, GFP-Iduna or GFP-Iduna-YRAA in primary cortical neurons. No signal is seen in control cultures (*) non-specific band. Data were repeated three times with similar results. (d) Quantification of 500 μM NMDA induced cell death in primary cortical neurons with lentiviral expression of GFP, GFP-Iduna or GFP-Iduna-YRAA. Control cultures were treated with control salt solution (CSS) alone. NT, non-transduced. n=12–20 from two experiments. *p < 0.05 (e) Quantification of cell death in cortical neurons treated in an identical manner to panel 4d but cell death was assessed via AlamarBlue® reduction assay. Data represents mean ± SEM, n=5, *p < 0.05 by ANOVA with Tukey-Kramer’s posthoc test. (f) Quantification of cell death due to DNA damage by MNNG in primary neuronal cultures expressing GFP, GFP-Iduna or GFP-Iduna YRAA. Data represent mean ± SEM, n = 5 of two experiments. *p ≤ 0.05 by ANOVA with Tukey-Kramer’s posthoc test.

