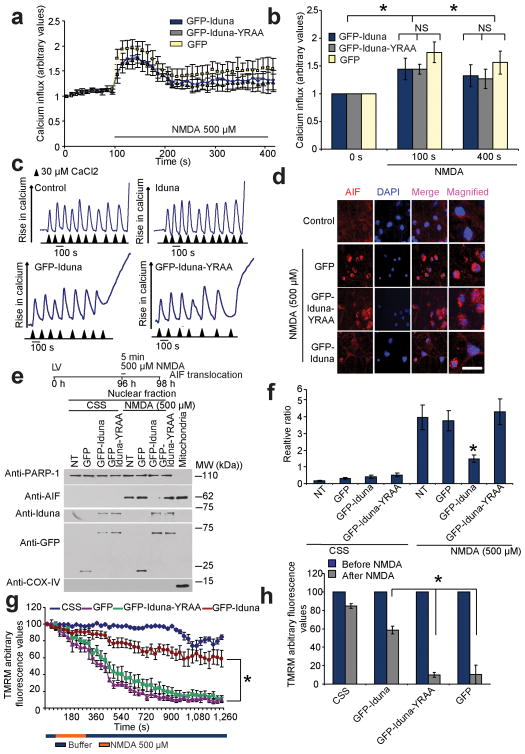
Figure 5.
Iduna does not interfere with NMDA-induced changes in Ca2+ or mitochondrial Ca2+ loading, but prevents AIF translocation and reductions in mitochondrial membrane potential (Δψm). (a) Ca2+ influx imaged in primary cortical neurons expressing GFP, GFP-Iduna or GFP-Iduna-YRAA assessed by the Ca2+-sensitive fluorochrome fluo-5F (2.0 μM) over time. Intensity gain in these neurons was reduced to avoid saturation effects because of the spectral overlap between GFP and fluo-5F. (b) Graphic representation of Ca2+ influx before and after 500 μM NMDA. *p < 0.05 by ANOVA with Tukey-Kramer’s posthoc test. (c) Assessment of mitochondrial Ca2+ uptake in isolated mitochondria incubated with or without recombinant Iduna protein (top panels) or digitonin permeabilized MCF7 cells expressing GFP-Iduna or GFP-Iduna-YRAA (bottom panels), using Calcium green-5N as an indicator of free Ca2+. Experiments were repeated twice with similar results (d) Representative confocal photomicrographs of NMDA-induced AIF translocation in cortical neurons expressing GFP, GFP-Iduna or GFP-Iduna-YRAA. AIF immunoreactivity (red), DAPI (blue) scale bar = 20 μm (e) Immunoblot analysis of subcellular fractionations from cortical cultures treated as indicated in (d) for AIF. PARP-1, nuclear fraction, COX IV post-nuclear mitochondrial fraction. Data were repeated three times with similar results. (f) Quantification of AIF immunoblot analysis in (e). Data are the mean ± SEM from three experiments, *p < 0.05 vs NT after NMDA treatment by ANOVA with Tukey-Kramer’s posthoc test. (g) Analysis of Δψm, using TMRM live imaging in primary cortical neurons expressing GFP, GFP-Iduna or GFP-Iduna-YRAA. Neurons were treated with either 500 μM NMDA or CSS, *p < 0.05 (h) Graph shows loss of Δψm (TMRM fluorescence) before and after 20 min of NMDA application. *p < 0.05. Significance determined by ANOVA with Tukey-Kramer’s posthoc test.

