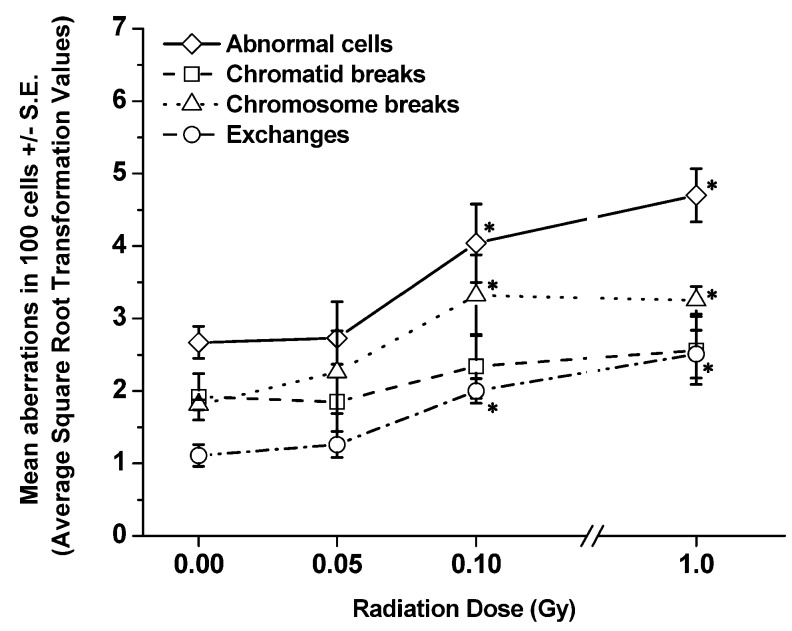
Figure 5.
Frequencies of each type of aberration per 100 cells scored (±S.E.) detected in BM cells collected from SCID/J mice at 6 mo post-irradiation. Significant differences in the frequencies of each type of CA in BM cells of exposed mice, as compared to the frequencies detected in non-irradiated sham controls are shown at “∗”.

