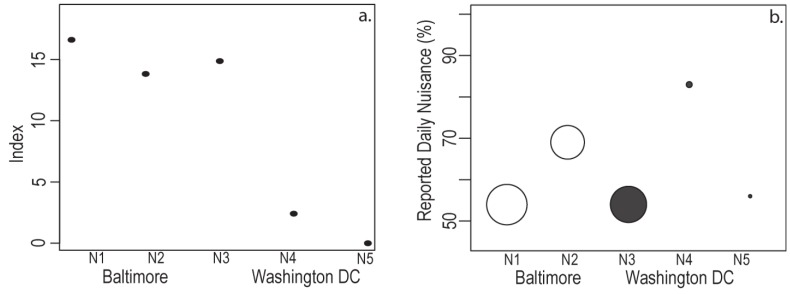
Figure 2.
(a) The relative index for risk of mosquito exposure is plotted for each neighborhood, shown in order of relative median income in each city. The risk index declines with income within a city and is universally high in the three neighborhoods with median household incomes at or below $40,000 (N1, N2, N3). (b) The percentage of residents that reported daily mosquito exposure (y axis) in each Baltimore (white) and Washington (black) neighborhood. Points are scaled by the risk index and larger points indicate greater risk.

