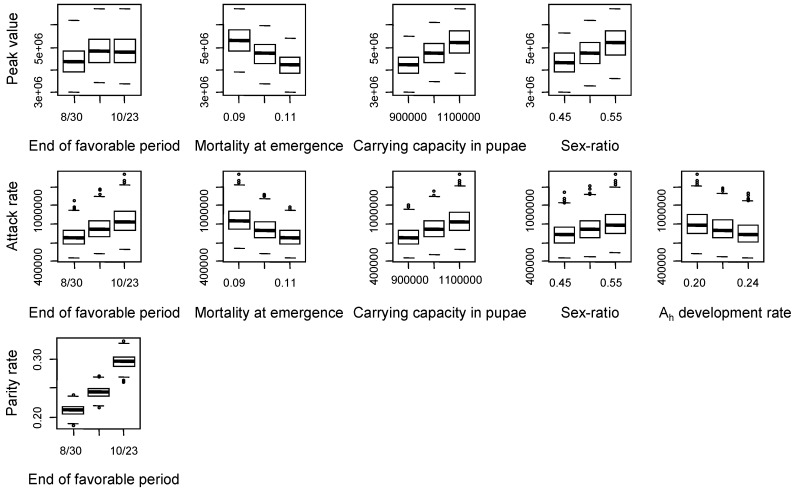
Figure 6.
Variations of model outputs (in lines) with parameters contributing to more than 10% of their variance (in columns): 3 levels were tested per factor (nominal value ±10%). For each considered parameter and model output, a box-and-whisker diagram graphically depicts the maximum, minimum, median, lower and upper quartiles values of the model output obtained from the simulations with three different levels of the parameter tested.

