
Figure 1.
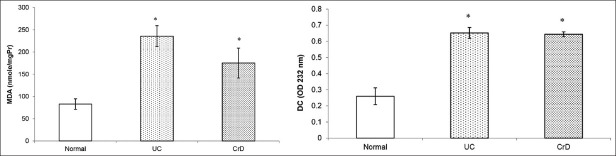
Box plots showing the levels of malondialdehyde and conjugated dienes in biopsies of UC and CrD patients and biopsies of control subjects. MDA and CD levels were significantly increased in UC and CrD biopsies of patients compared with those of control subjects (MDA: P < 0.001; CD P < 0.001). *P < 0.05 as compared with control subjects