
Figure 2.
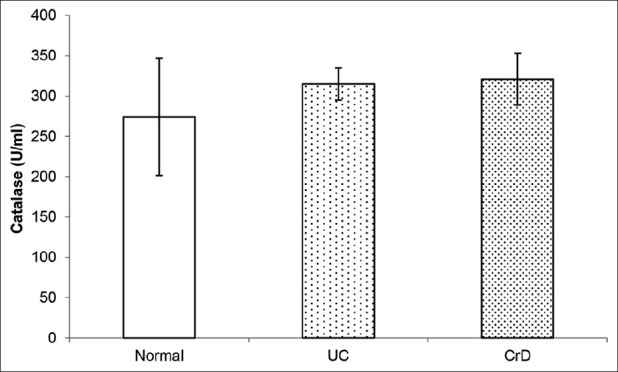
Box plots showing catalase activity in biopsies of UC and CrD patients and biopsies of control subjects. Our data show a non significant rise in catalase activity in UC and CrD patients’ biopsies compared with controls’ biopsies (P > 0.05)
Official websites use .gov
A
.gov website belongs to an official
government organization in the United States.
Secure .gov websites use HTTPS
A lock (
) or https:// means you've safely
connected to the .gov website. Share sensitive
information only on official, secure websites.
Box plots showing catalase activity in biopsies of UC and CrD patients and biopsies of control subjects. Our data show a non significant rise in catalase activity in UC and CrD patients’ biopsies compared with controls’ biopsies (P > 0.05)