
Figure 3.
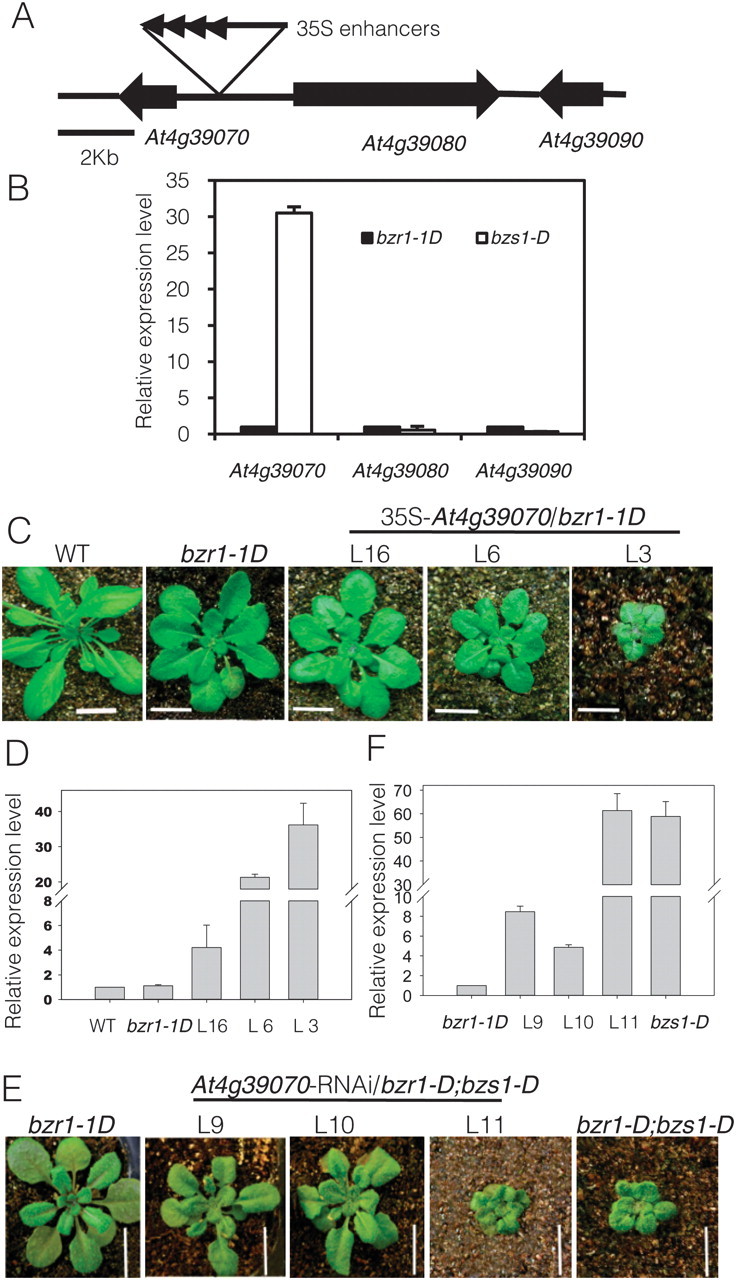
BZS1/BBX20 Is Responsible for the bzs1–D Phenotypes.
(A) A diagram of the genomic region flanking the T-DNA insertion site in bzr1–1D;bzs1–1D.
(B) Quantitative RT–PCR analysis of the genes flanking the T-DNA insertion.
(C) Overexpression of BZS1 in bzr1–1D (two independent lines: L6 and L3) recapitulates phenotype of bzr1–1D;bzs1–D.
(D) Quantitative RT–PCR analysis of the expression level of BZS1 in three independent overexpression lines.
(E) Suppressing the expression of BZS1 using RNAi in bzr1–1D;bzs1–D (two independent lines: L9 and L10) restores bzr1–1D phenotype.
(F) Quantitative RT–PCR analysis of the expression level of BZS1 in BZS1–RNAi plants. For all the qRT–PCR analysis, UBC30 was used as internal control.