Figure 4.
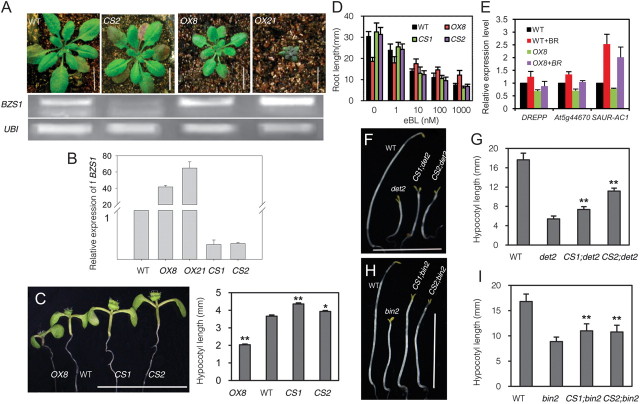
Overexpression of BZS1 Partly Inhibits BR Signaling.
(A) Soil-grown 3-week-old plants of wild-type and transgenic plants (upper panel); RT–PCR analysis of BZS1 expression (lower panel).
(B) Quantitative RT–PCR analysis of BZS1expression level in WT and BZS1–OX transgenic lines (OX8 and OX21) and co-suppressed lines (CS1 and CS2). UBC30 was used as internal control.
(C) Phenotypes of 7-day-old light-grown seedlings of wild-type, OX8, CS1, and CS2 (left panel) and the measured hypocotyl lengths (right panel). Representatives of the tallest seedlings of each population were chosen for photographs. Error bars indicate SD (n = 30), and significant differences from wild-type are marked (** P < 0.01, * P < 0.05).
(D) Quantification of the root length of seedlings grown on half-strength MS containing various amounts of BR.
(E) qRT–PCR analysis of downstream genes in wild-type and BZS1–OX8 plants with or without 100 nM eBL treatment (3 h). UBC30 was used as internal control.
(F, H) Dark-grown phenotypes of det2 (F) or bin2-1 (H) crossed with BZS1–CS lines (CS1 and CS2).
(G, I) Hypocotyl lengths of dark-grown seedlings in (F) and (H), respectively. Error bars indicate SD (n = 20), and significant differences from wild-type are marked (** P < 0.01, * P < 0.05).

