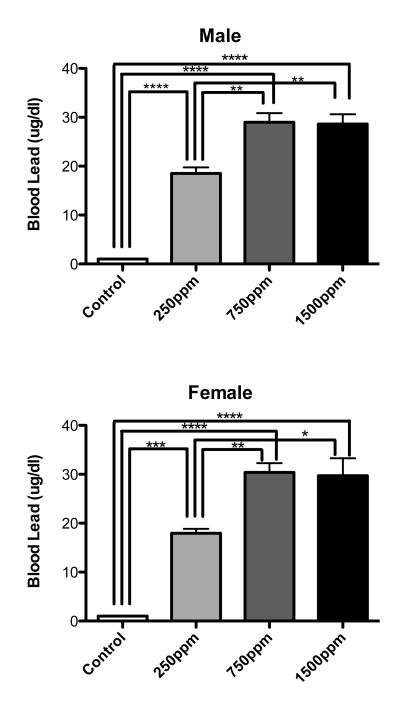
Figure 1.
Blood lead levels (BLL) in animals on the last day of lead exposure. Both male and female postnatal day 21 animals showed significantly elevated BLL when compared to age matched controls not exposed to lead. There were no significant differences between males and females in BLL at any level of lead exposure. Interestingly, BLL’s did not increase in 1500ppm exposed animals when compared to 750ppm exposed animals. Data are mean blood lead level ± S.E.M. All statistically significant differences between exposures are designated on the graphs using connecting lines. * = p<0.05, ** = p<0.01, *** = p<0.001, **** = p<0.0001

