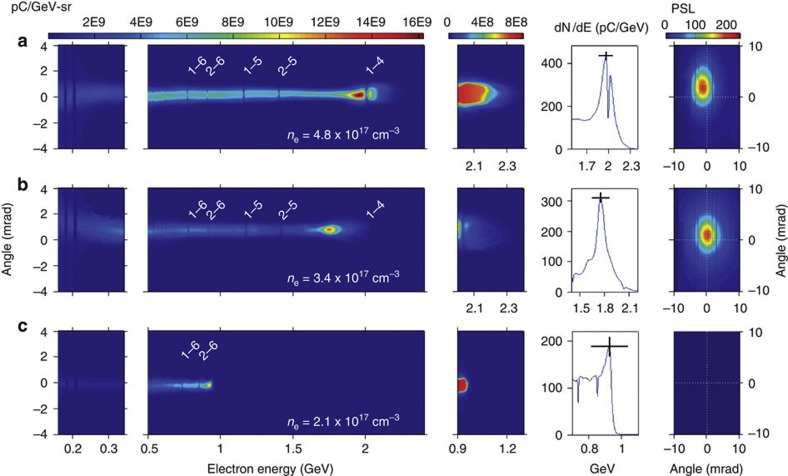
Figure 2. Electron spectra and betatron X-ray profiles for three shots from the accelerator.
First column: sub-GeV electron spectra recorded on IPLE; second column: GeV electron spectra recorded on IPHS; third column: detail of high-energy tails; fourth column: vertically integrated spectra around each high-energy peak; fifth column: betatron X-ray angular distribution recorded on IPHS. (a) Results for shot yielding quasi-monoenergetic peak at 2.0 GeV, with ne=4.8 × 1017 cm−3, obtained from raw data shown in Fig. 1e. Results for (b) ne=3.4 × 1017 cm−3, yielding peak at 1.8 GeV, and (c) ne=2.1 × 1017 cm−3, yielding peak at 0.95 GeV. Table 1 lists complete laser-plasma conditions and e-beam properties for each shot. Fiducial wire shadows are labelled as in Fig. 1b. On each vertical scale, ‘0 mrad’ denotes the average vertical position of a 30-shot sequence of GeV electrons. In the fourth column, vertical error bars represent the average uncertainty in the calibration of each of IPHS, high-resolution IP (IPHR) and LANEX as charge monitors (±10%); horizontal error bars represent 2σ uncertainty in the peak position, derived from the uncertainty in fitting the calculated trajectories of electrons near 2 GeV to the observed positions of fiducial shadows on IPHS for each shot. This uncertainty originates in turn from the combined uncertainty in fiducial wire positions (±25 μm transversely, ±2 mm longitudinally), fiducial shadow positions (±1/2 pixel, or ±50 μm), electron source position (determined by X-ray triangulation) relative to magnet and detector (±75 μm transversely, ±1 cm longitudinally) and magnetic field (±1%).

