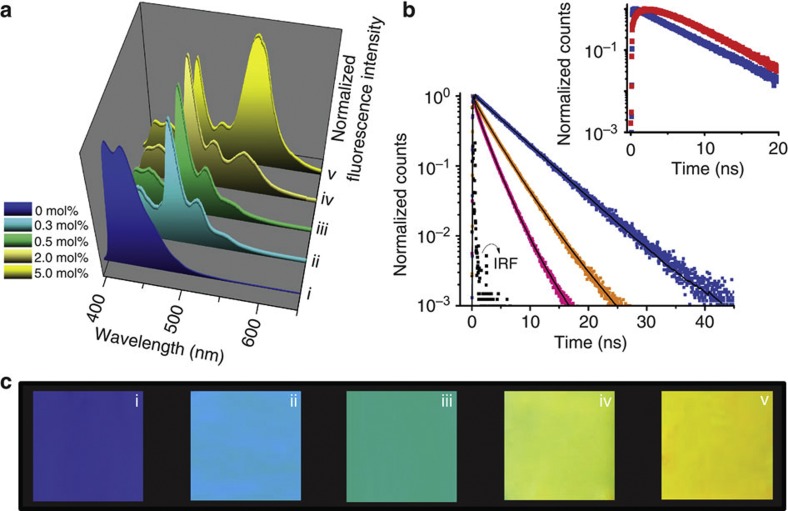
Figure 5. Energy-transfer-assisted tunable emission.
(a) Normalized emission spectral changes of 1 upon increasing the concentration of D1 (λex=350 nm). (b) Emission lifetime decay profile of 1 (blue squares) (λex=377 nm) in the presence of 0.3 (orange squares) and 0.5 mol% (pink squares) of D1 monitored at 430 nm supported on quartz plate, and inset shows the decay profiles of D1 (0.3 mol%) in the matrix of 1 (red squares) and D1 alone (blue squares), monitored at 475 nm (λex=377 nm). IRF corresponds to Instrument Response Function. (c) Photographs of the luminescent thin films of 1 (i) and 1 doped with D1 (ii–v), which are correlated to the emission spectra of (a).

