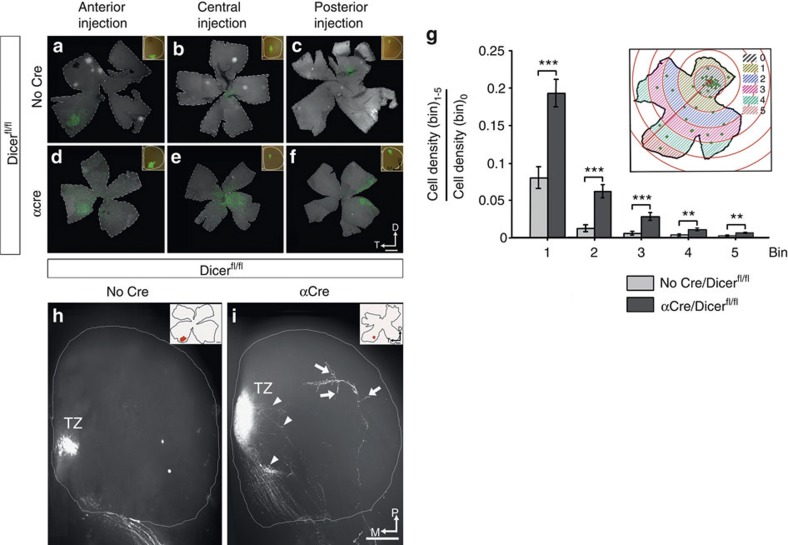
Figure 5. Retinotopic map of lesion-induced expanded projections is less precise.
(a–f) Whole retina flatmounts detecting RGCs after retrograde labelling using fluorescent microbeads injected in the contralateral SC of control (a–c) or lesion-induced mutant mice (d–f) at P8. Injections were made in the anterior (a,d) (n=3 for both genotypes), central (b,e) (n=4 α-Del, n=5 wild-type) and posterior (c,f) (n=6 α-Del, n=5 wild-type) SCs of mice (insets) which result in labelled RGCs in temporal, central and nasal retina, respectively. α-Del mutant mice show general conservation of the topographic map, however, exhibit larger spread of retrogradely labelled cells. (g) Quantification of spread by binning the labelled RGCs in six concentric circles (0–5), centred around the point with highest RGCs density (0). The ratio of labelled cells was calculated for each bin (1–5) in relation to the number found in the central circle (0, schematic). Retinae from α-Del mutant mice showed a significantly higher spread for each bin compared with wild-type littermates. Sample passed Kolmogov–Smirnov test. Analysis of variance followed by Bonferroni post-hoc test was applied. (n=13 for both genotypes). Values are mean±s.e.m. ***P<0.001, **P<0.01. (h,i) Dorsal view of the SC of wild-type and α-Del mice at P8 after focal DiI injections into the contralateral eye. Ventral DiI injections lead to a TZ in medial SC in both genotypes. However, the lesion-induced mutant mice show consistently larger TZs with areas of loosely organized arborizations surrounding the TZ (arrowheads). In addition, several aberrant branches outside the appropriate TZ location are detected (arrows). Insets show the position of DiI injection in the retina (n=5 wild-type, n=2 α-Del). D, dorsal; M, medial; P, posterior; T, Temporal. Scale bar, 500 μm (a–f) and Scale bar, 200 μm (h,i).

