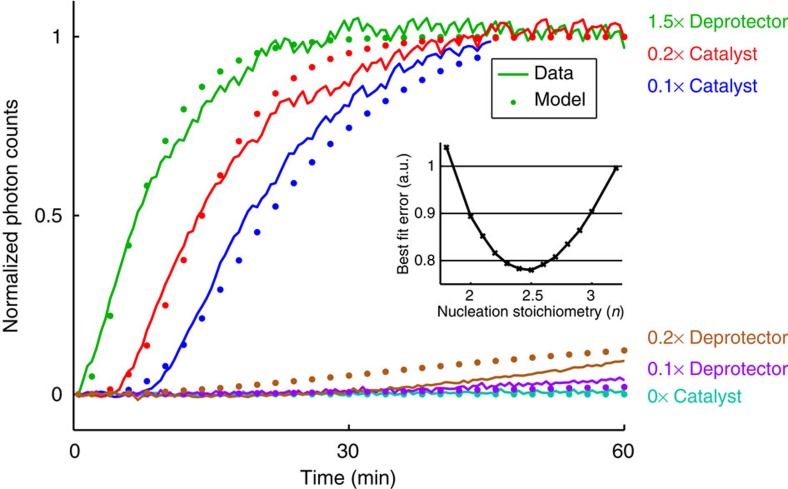
Figure 5. Modeling and quantitation of DNA nanotube growth.
Normalized photon counts of time for time-lapse TIRF microscopy images and control experiments shown as Supplementary Movie 4 (these are distinct from experiments shown in Figure 4); this value corresponds to the amount of deprotected monomers incorporated into tubes. In all experiments shown here, [protected tile]=200 nM (1 × ) and [sink]=40 nM (0.2 × ). For the green, brown, and purple traces, the listed quantity of deprotector was introduced at time t≈0. For the red and blue traces, [fuel]=600 nM (3 × ) and [substrate]=300 nM (1.5 × ) were present in solution initially, and the listed quantity of catalyst was introduced at time t=0. Shown in dotted lines are the expected kinetic behaviors predicted by our model using a best-fit nucleation stoichiometry value of n=2.5; the inset shows the relative sum of squared error for different values of n (with corresponding best-fit knuc, kdeprot and ksink rate constants). The model captures the qualitative differences of the different traces; quantitative agreement is limited due to many uncharacterized parameters and the simplicity/incompleteness of model reactions.

