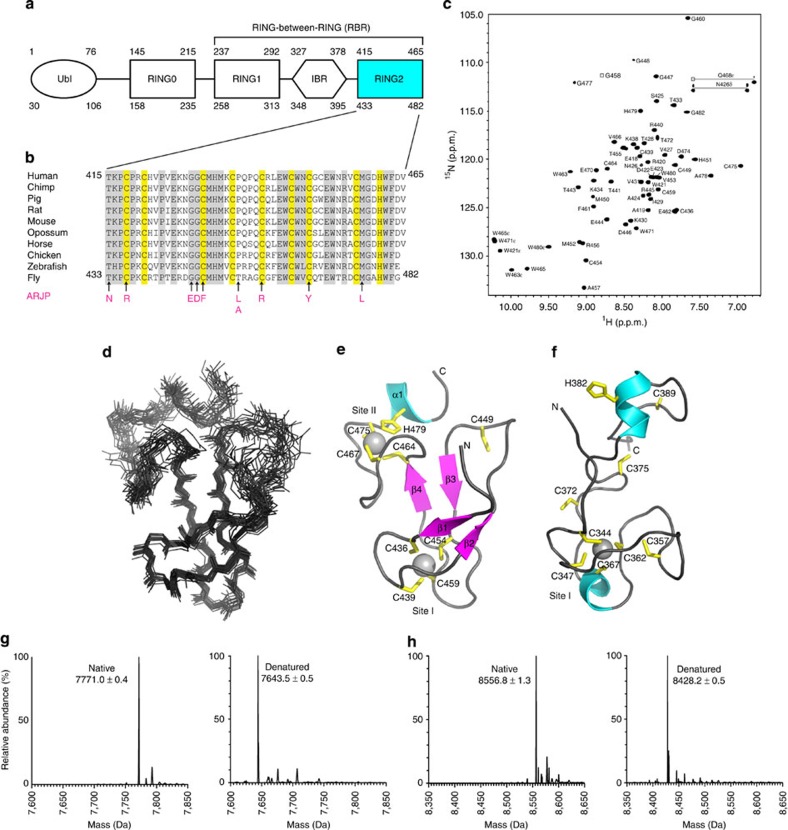
Figure 1. Sequence alignment, structure and metal analysis of parkin RING2 domain.
(a) Domain structure of parkin showing the C-terminal RING1, IBR and RING2 domains found in all RBR E3 ligase proteins. The ubiquitin-like (Ubl) and RING0 domains are specific to the parkin E3 ligase. Residue numbering is shown for both the human (top) and D. melanogaster (bottom) parkin sequences. (b) Multiple sequence alignment of the RING2 domain for parkin orthologues. Sequence numbers are indicated for the human and D. melanogaster species only. Conserved (grey) and cysteine/histidine (yellow) residues are highlighted. Substitutions that contribute to ARJP in the parkin RING2 domain are shown below the sequences (magenta). (c) Assigned 600 MHz 1H–15N HSQC spectrum of 13C,15N-labelled parkin RING2 (500 μM in 20 mM Tris–HCl, 120 mM NaCl, 1 mM DTT, pH 7.25), labelled using the one-letter amino acid code and residue number according to the D. melanogaster parkin sequence. (d) Superposition of the 20 lowest energy solution structures of parkin RING2 (residues 430–482, backbone r.m.s.d. 0.82±0.17 Å). (e) Ribbon structure of parkin RING2 showing β-strands β1 (T433–P435), β2 (P442–E444), β3 (H451–V453) and β4 (E462–C464), and helix α1 (M476–W480). Side chains for Zn2+-coordinating residues are shown in yellow. (f) Structure of the HHARI RING2 (ref. 35) (PDB accession code 1WD2) showing different zinc occupancy and fold compared with parkin (e). Deconvoluted mass spectra for native and denatured parkin RING2 (g), and native and denatured HHARI RING2 (h). The mass differences of 127.5 Da (g) and 128.4 Da (h) indicate the presence of two bound Zn2+ ions in the native proteins. Raw data are found in Supplementary Figure S2. Structures were visualized using Pymol (PyMOL Molecular Graphics System, Version 1.5.0.4 Schrödinger, LLC).

