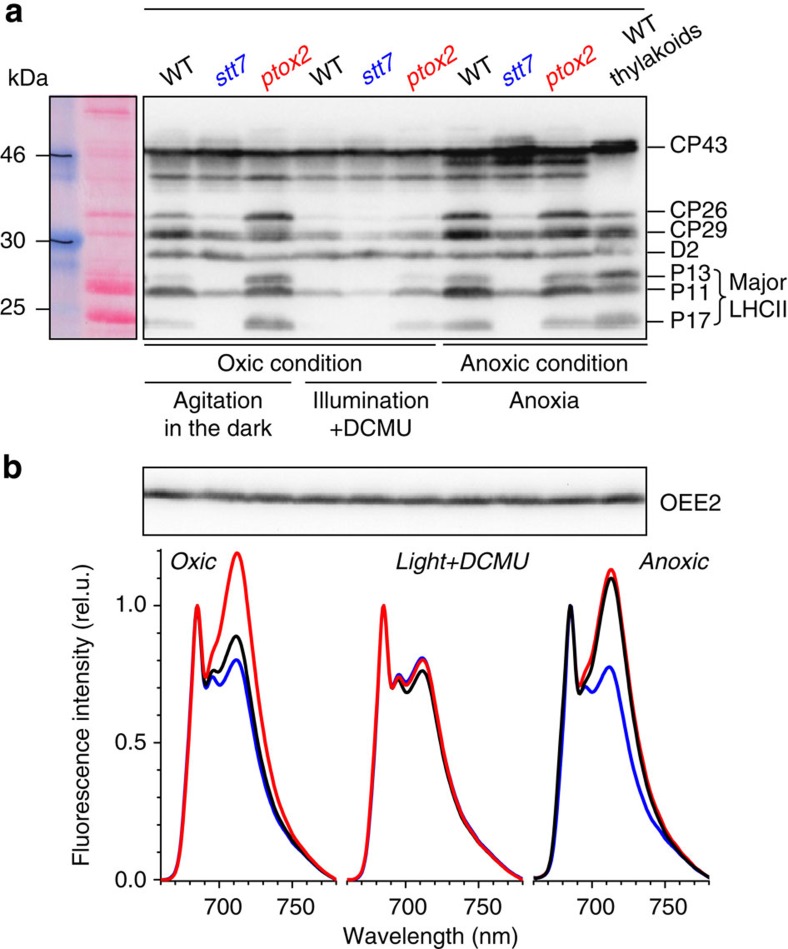
Figure 2. Characterization of the three strains used in this study.
Panel a shows an immunoblot with an anti-phosphothreonine antibody of wild type, stt7 and ptox2 cells in two oxic conditions and in anoxia. When illuminated in the presence of DCMU (center), all strains displayed a similar pattern, typical of State 1, with little -if any- phosphorylation of P13 and P17 and low phosphorylation of P11, CP26 and CP29. In anoxic conditions (right), the wild type and ptox2 - but not stt7-, showed a marked increase in phosphorylation of P11, P13, P17, CP29 and CP26, in good agreement with (refs 17,19). In the stt7 strain, the phosphorylation level of P17 and P13 remained unchanged despite a small increase in P11, CP26 and CP29 phosphorylation as reported in the study by Lemeille et al.19 When stirred in the dark (left), ptox2 cells showed a pattern similar to the anoxic condition, indicating State 2, in contrast to stt7 cells, which were similar to the light+DCMU condition (State1). In these conditions, the wild type also showed a pattern similar to State 1, albeit with a low level of P13 and P17 phosphorylation indicating low level activation of the kinase. OEE2 was used as a loading control. Panel b shows the low-temperature emission spectra, diagnostic of the relative absorption cross section of PS I and II. The spectra have been normalized to their amplitude at 685 nm. Two mains peaks are resolved at 684 nm and in the 715 nm region, which respectively correspond to fluorescence by PS II and PSI. In the wild type (black spectra), the former is larger than the latter in State 1 (oxic and vigorous stirring in the dark) conditions and vice versa in State 2 (anoxic) conditions21. In stt7 (blue spectra), light-emission from PS II largely prevailed in both conditions as previously reported17, whereas in the ptox2 strain (red spectra) light emission was dominated by PSI fluorescence in agreement with the study by Houille-Vernes et al.15

