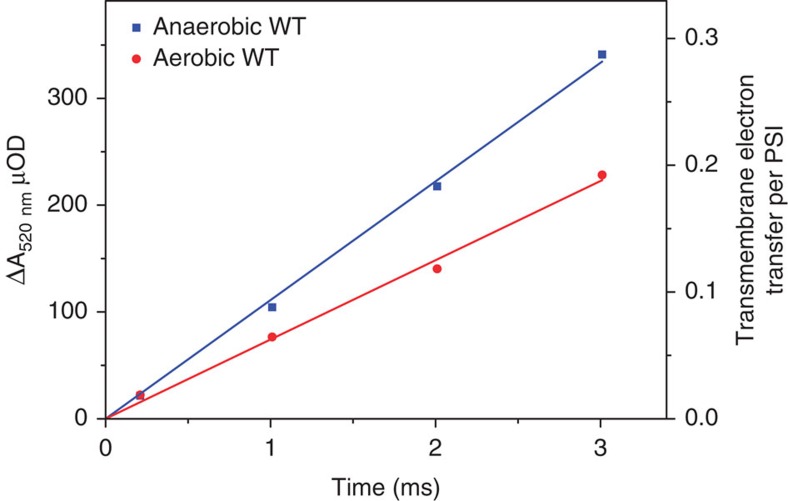
Figure 3. Assessing the variation of the PSI antenna size upon ST.
The figure shows the time course of the absorption changes measured at 520 nm upon continuous illumination with wild-type cells in oxic and anoxic conditions (after 35 min of anoxia). The right y axis was scaled taking as a reference the signal resulting from the transmembrane charge transfer of one electron per PSI, that is, the absorption changes measured upon a single-turnover saturating laser flash in the absence of PS II activity.

