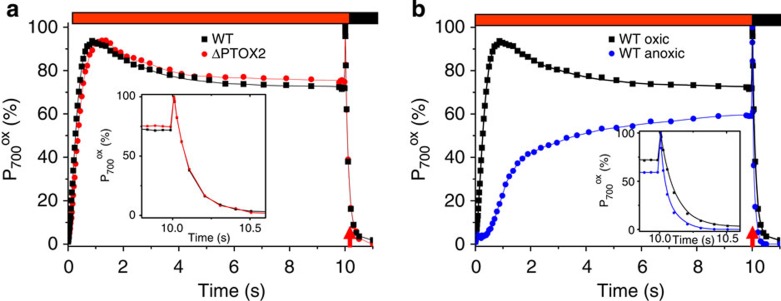
Figure 4. Assessing cycling electron flow via the redox changes of P700.
As indicated by the red horizontal bar, the samples were submitted to a continuous illumination followed by a pulse of saturating intensity (highlighted by the red arrow). The inset shows a zoom on the reduction of P700+ in the dark following this pulse. The left panel shows the redox changes of P700 in the wild type and ptox2 strains in oxic conditions and the right panel compares the kinetics of the redox changes in the wild type in oxic and anoxic conditions. In the former case, the cells were kept in the dark under vigorous stirring to induce State 1 in the wild type and State 2 in ptox2 (see text and Fig. 2 for details). To inhibit LEF and allow the assessment of CEF, DCMU was added just before the measurement. In anoxic conditions, the kinetics were measured after 35 min of incubation in anoxia to alleviate acceptor side limitation. The efficiency of CEF may be assessed via the steady state value of the fraction of P700 being reduced (the larger this fraction, the more efficient CEF).

