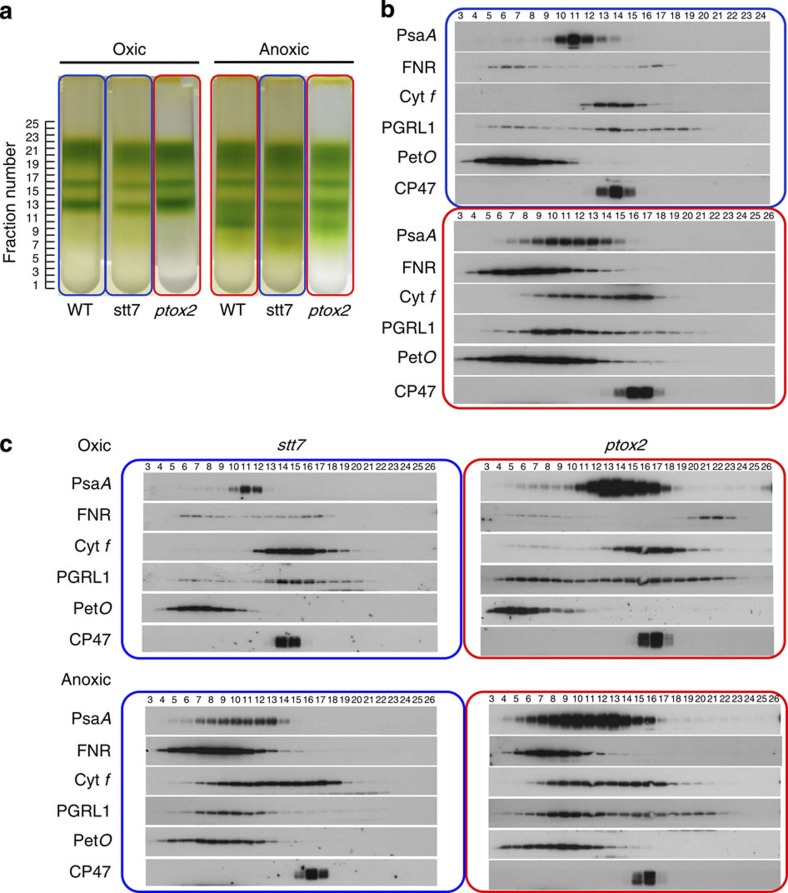
Figure 6. Formation of CEF supercomplexes upon shift from oxic to anoxic conditions.
Panel a shows the sucrose density gradient in the wild type, stt7 and ptox2 strain in oxic (left) and anoxic conditions (right). The blue frames indicate State 1, the red frames State 2. In all strains, a high-molecular weight green band was found in anoxic, but not in oxic conditions. Western blot analysis of the gradients (panels b and c) showed that this high-molecular weight band (in fractions 8–12) contains PS I, the b6f complex, FNR, PetO, PGRL1 in good agreement with the study by Iwai et al.13 Fractions were loaded on an equal volume basis.

