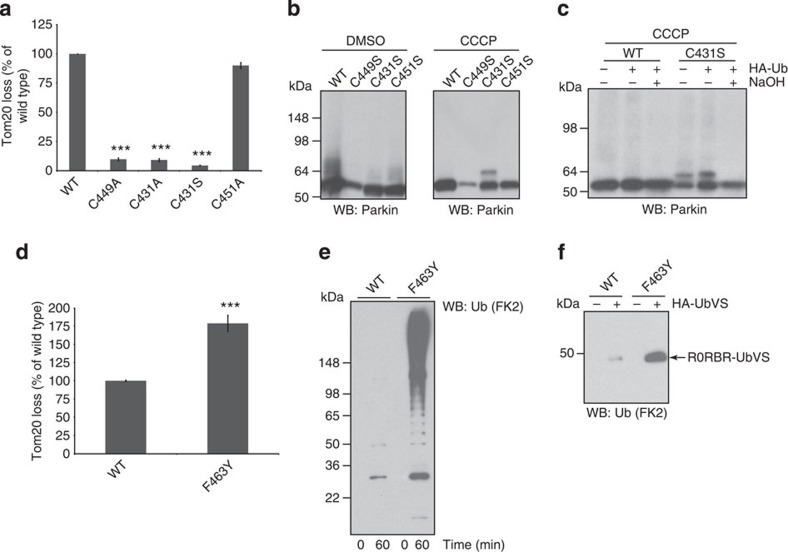
Figure 4. Mitochondrial stress activates Parkin and drives exposure of the active site C431.
(a) Parkin active site mutants C431S/C431A compromise Parkin’s ability to decrease cellular Tom20 levels. Mutations in Parkin’s Zn binding residue C449 also inhibited Parkin’s ability to function in this assay. Full-length wild-type Parkin-induced Tom20 loss after CCCP treatment. DMSO treated was set to 100%. Data shown are representative of three-independent experiments (error bars represents s.e.m.). The significance levels were determined using the heteroscedastic Student’s t-test with two-tailed distribution. Triple asterisk denotes P≤0.005 (C449A, P=0.00006; C431A, P=0.00004; C431S P=0.001). (b) Western blot showing formation of ~8 kDa Parkin immunoreactive species during mitochondrial stress (CCCP) only in cells expressing full-length Parkin C431S. (c) Western blot showing the ~8 kDa Parkin immunoreactive species is sensitive to sodium hydroxide treatment indicative of ubiquitin oxyester formation on full-length Parkin C431S. (d) Enhanced cellular activity of full-length Parkin F463Y compared to full-length wild-type Parkin. Data shown are representative of three-independent experiments (error bars represent s.e.m.). The significance levels were determined using the heteroscedastic Student’s t-test with two-tailed distribution. Triple asterisk denotes P≤0.005 (F463Y, P=0.002). (e) Autoubiquitination of R0RBR F463Y is increased compared with wild-type R0RBR. (f) Increased HA-Ub-VS probe labelling of R0RBR F463Y compared with wild-type R0RBR.

