
Fig. 1.
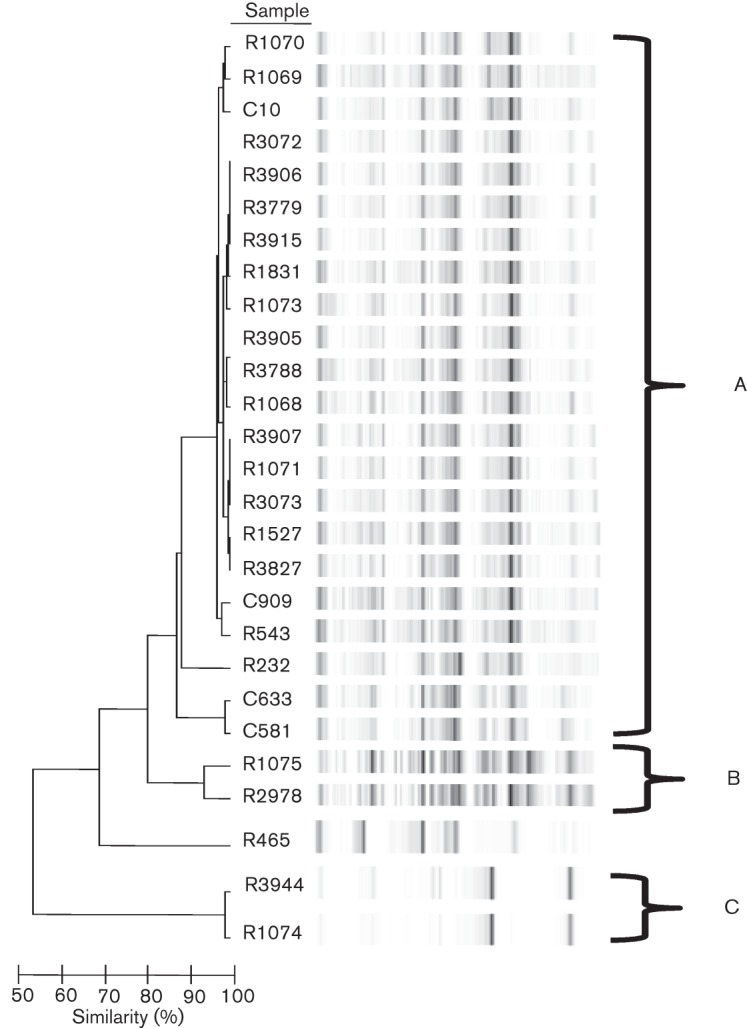
Dendrogram of Hif isolates. DNA was isolated from 26 Hif isolates and used as template DNA for repPCR with primers ERIC1 and ERIC2 (Table 2). The resultant amplicons were resolved on an Agilent 2100 with Diversilab DNA chips to create virtual electropherograms and Bacterial Barcodes software was used to calculate a similarity index for the isolates. Isolates with a similarity index of ≥85 % were considered to be identical. Banding patterns are shown for the 26 isolates, organized into three unrelated clusters, A–C, with the majority of isolates (22/26, 85 %) in cluster A. The non-typable strain R465, analysed previously by ERIC sequence-based PCR fingerprinting in our laboratory (Watson et al., 2004), was included as a control and was confirmed to be unrelated to the other strains in the study.