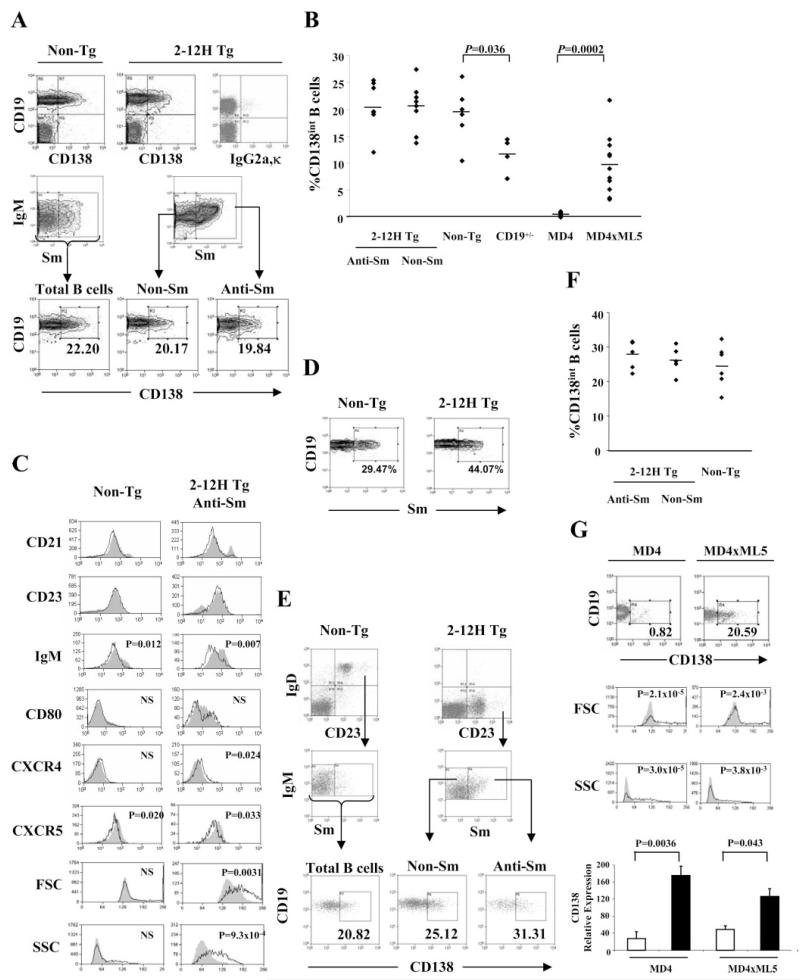
FIGURE 1.
CD138int cells are present at a high frequency in the spleens and BM of non-Tg and 2-12H mice. A, CD138 expression by splenic B cells. Top row, CD19 and CD138 staining of total splenic lymphocytes in non-Tg and 2-12H littermates as determined by forward scatter (FSC) and side scatter (SSC). The right histogram is a representative isotype (IgG2a,κ) control stain (1.19 ± 0.25% (n = 4) falling within the CD19+, CD138+ quadrant). Middle row, Shown are histograms for IgM and Sm staining of CD19+ B cells from non-Tg and 2-12H mice. The indicated gate is that for the Sm+ population analyzed in the bottom row. Bottom row, Shown is the CD138 expression of gated Sm+ and Sm− B cells from 2-12H mice and total B cells from non-Tg mice. The percentage of CD19+ B cells that are CD138int is provided. B, Frequency of CD19+CD138int B cells among CD19+ B cells. Each symbol represents a single mouse and a horizontal line marks the mean. Absolute numbers of CD138int B cells are 5.48 × 10⁶± 1.16 × 10⁶ (n = 8) for 2-12H anti-Sm, 8.19 × 10⁶± 1.77 × 10⁶ (n = 8) for 2-12H non-Sm, and 2.37 × 10⁷± 6.47 × 10⁶ (n = 6) for non-Tg mice, 4.91 × 10⁶± (Figure legend continues) 4.66 × 10⁵ (n = 4) for CD19+/− mice, 2.7 × 10⁵± 1.63 × 10⁵ (n = 8) in MD4 mice, and 1.20 × 10⁶± 4.76 × 10⁵ (n = 11) in MD4 × ML5 mice. C, Activation marker expression by CD19+ CD138− B cells (shaded) and CD19+ CD138int (black line) from non-Tg and 2-12H mice. Representative histograms are shown. Values of p are given for the differences between the CD138int and CD138− cells. D, Sm binding by CD138int B cells. Histograms are gated on CD138int B cells from the indicated mice as illustrated in A (upper right quadrant of top row). The percentage of anti-Sm CD138int B cells is provided. The average percentage for non-Tg and 2-12H mice is given in Table I. E, CD138 expression by BM B cells. Top row, Histograms are gated on CD19+ cells to identify the recirculating IgD+CD23+ B cells. Middle row, Sm binding by gated IgD+ CD23+ B cells. Bottom row, CD138 expression by the indicated B cell subsets. The percentage of gated B cells that are CD138+ is given. F, Frequency of CD138int B cells among the recirculating IgD+CD23+ B cells of the BM. Each symbol represents a single mouse and a horizontal line marks the mean. G, CD19+ CD138int B cells are absent in anti-HEL MD4 mice, but present in anti-HEL/HEL MD4 × ML5 mice. Frequency of CD138int B cells is given as percent of CD19+ B cells. The FSC and SSC for CD138− (shaded) and CD138int (solid line) B cells are shown along with the p values for the differences in mean fluorescence intensities. The gating for CD138int cells is indicated in the top histograms. The CD138− B cells were all CD19+ cells that fell outside the CD138int gate. Lower graph shows real-time PCR results for CD138 expression using sorted CD138− and CD138int B cells from MD4 and MD4 × ML5 mice.

