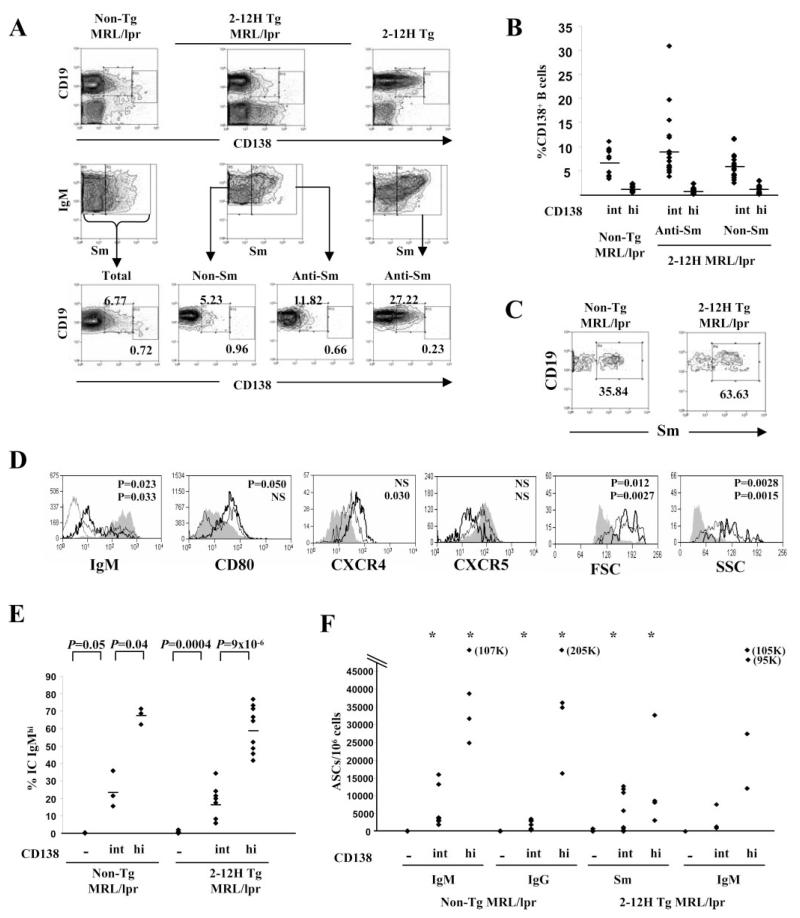
FIGURE 4.
Anti-Sm CD138int B cells are ASCs in autoimmune mice. A, CD19+CD138int and CD19+CD138high B cells are present in non-Tg MRL/lpr mice and as anti-Sm and non-Sm B cells in 2-12H MRL/lpr mice. T cells from MRL/lpr mice express CD138 and have been excluded from the histograms of the top row by anti-CD3 staining and gating on the CD3-negative cells. The histograms of the middle row are gated on CD19+ lymphocytes, and the bottom row on the indicated Sm-binding or non-Sm-binding populations. B, Frequency of CD19+CD138int and CD19lowCD138high B cells as a percentage of CD19+ B cells. Each symbol represents a single mouse, and the horizontal line marks the mean frequency. The number of CD19+CD138int B cells is as follows: 9.48 × 10⁶± 3.55 × 10⁶ for non-Tg MRL/lpr (frequency: 6.8 ± 2.5% of CD19+ B cells); 2.12 × 10⁶± 1.49 × 10⁶ for 2-12H MRL/lpr anti-Sm (frequency: 3.0 ± 2.1% of CD19+ B cells); and 2.67 × 10⁶± 1.31 × 10⁶ for 2-12H MRL/lpr non-Sm (frequency: 3.8 ± 1.8% of CD19+ B cells). The number of CD19lowCD138high cells are as follows: 1.46 × 10⁶± 8.46 × 10⁵ for non-Tg MRL/lpr (frequency: 1.04 ± 0.174% of CD19+ B cells); 1.48 × 10⁵± 1.20 × 10⁵ for 2-12H MRL/lpr anti-Sm (frequency: 0.66 ± 0.130% of CD19+ B cells); and 4.27 × 10⁵± 3.52 × 10⁵ for 2-12H MRL/lpr non-Sm (frequency: 0.900 ± 0.180% of CD19+ B cells). The number and frequency of CD138int from 2-12H nonautoimmune mice is given in Fig. 1. The number of anti-Sm CD138high B cells in 2-12H mice is 4.24 × 10⁴± 8.33 × 10³ (frequency: 0.127 ± 0.0249% of CD19+ B cells). The number of CD138high B cells in nonautoimmune non-Tg mice is 2.92 × 10⁵± 5.78 × 10⁴ (frequency: 0.23 ± 0.047% of CD19+ B cells) (using gates (Figure legend continues) identical to those used for 2-12H mice). The frequency of anti-Sm CD138high B cells in 2-12H and 2-12H MRL/lpr mice differs significantly (p = 0.0084). C, Sm binding by CD138int B cells. Histograms are gated on CD138int B cells from the indicated mice as illustrated in A (upper right quadrant of top row). The percentage of anti-Sm CD138int B cells is provided. The average percentage for non-Tg and 2-12H mice is given in Table I. D, FSC, SSC, and activation marker expression for CD19+CD138− (shaded), CD19+CD138int (thin black line), and CD19lowCD138high (thick black line) B cells from 2-12H Tg MRL/lpr mice. Representative histograms are shown. Anti-IgM levels on T cells are shown as a negative control for IgM expression in the first panel. The p values for the differences between CD138− and CD138int (top value) and between CD138int and CD138high (bottom value) are given. E, The frequency of IC IgMhigh cells among CD138−, CD138int, and CD138high B cells from non-Tg and 2-12H Tg MRL/lpr mice. The horizontal line marks the mean frequency. The p values for the relevant comparisons are shown. F, ASCs among 106 sorted CD138−, CD138int, and CD138high B cells from non-Tg MRL/lpr and 2-12H MRL/lpr mice. *, Statistical significance from CD138− B cells (p < 0.05). The ELISPOT assays were as described for Fig. 1. Note that the scale is different from that for Fig. 3C.

