
Fig. 3.
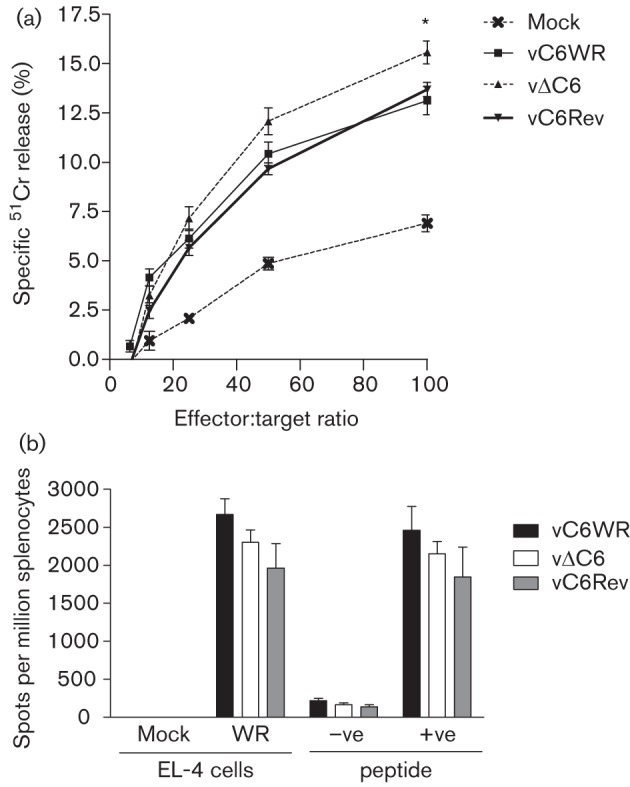
CD8+ T-cell responses 1 month post-vaccination. The cytolytic activity of T-cells derived from the spleens of groups of five C57BL/6 mice that had been vaccinated with 3×10³ p.f.u. of the indicated viruses, or mock vaccinated with PBS in both ear pinnae, was determined by 51Cr release assay (a) (Clark et al., 2006). Cytolytic activity of splenic T-cells was assayed against VACV strain WR-infected EL-4 target cells and is presented as the mean percentage±sem. IFN-γ release by splenic T-cells of mice vaccinated as described above was assessed by ELISPOT assay (b) (Clark et al., 2006). T-cells were stimulated to release IFN-γ ex vivo by incubation with WR-infected EL-4 target cells or the C57BL/6- and CD8+-specific B820–27 peptide (+ve) (Tscharke et al., 2005). As a control, T-cells were also stimulated with mock-infected EL-4 cells or the BALB/c-specific E3140–148 peptide (–ve) (Tscharke et al., 2006). Data are presented as the mean number of spots per million splenocytes±sem. Significant differences between data obtained for vΔC6 from both vC6WR and vC6Rev are indicated, as analysed by the Student’s t-test (*P<0.05). Data are representative of at least two experiments.