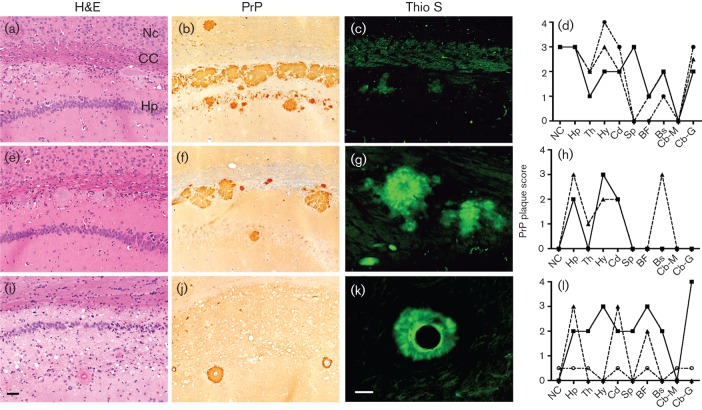
Fig. 4.
Neurohistology of Tg(Elk3M,NTVIIR)20841 (a–d), Tg(Elk3M,NTIIIR)20909 (e–h) and Tg(Elk3M,NTVIVK)16306 (i–l) mice infected with Elk1P prions. Hippocampal sections were stained with haematoxylin and eosin (H&E) to evaluate spongiform degeneration, nerve cell loss and plaque formation (a, e, i); immunostained for PrP (b, f, j); or stained with thioflavin S (Thio S) to determine whether the plaques formed amyloid (c, g, k). PrP plaque scores (d, h, l), based on PrP immunohistochemistry obtained from multiple brain regions, demonstrate that the three Tg mouse lines produced different quantities and distributions of PrP plaques; each line on the graphs indicates scores from an individual mouse. Bars, 50 µm [(i); applies to all the H&E-stained and PrP-immunostained sections]; 25 µm [(k); applies to all the Thio S-stained sections]. NC, Neocortex; CC, corpus callosum; Hp, hippocampus; Th, thalamus; Hy, hypothalamus; Cd, caudate nucleus; Sp, septum; BF, basal forebrain; Bs, brainstem; Cb-M, cerebellar cortex, molecular cell layer; Cb-G, cerebellar cortex, granule cell layer.

