Fig. 3.
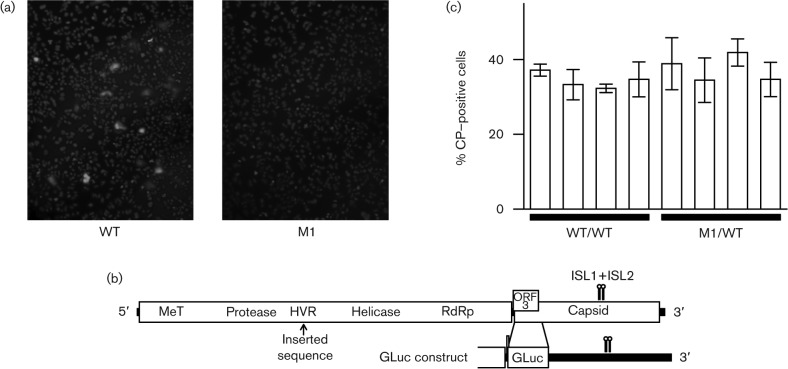
Analysis of ISL1+ISL2 mutants. (a) Representative example of IF microscopy of S10-3 cells stained for capsid protein (green) and nuclei (blue) 4 days after transfection with WT or M1 genomes. (b) Schematic map of WT virus and the GLuc construct indicating the position of the hypervariable region (HVR) and the inserted Gaussia luciferase gene relative to ISL1 and ISL2. (c) Flow cytometry of S10-3 cells immunostained for capsid protein 3 days after transfection with WT/WT or M1/WT viruses (four clones of each). Bars indicate the SD of three measurements.

