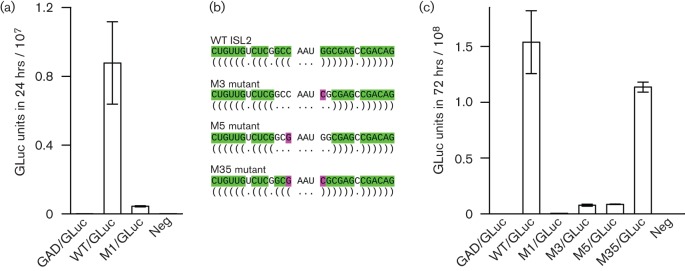
Fig. 4.

Analysis of virus genomes expressing luciferase. (a) S10-3 cells were transfected with the indicated virus genomes expressing Gaussia luciferase and aliquots of medium were tested for luciferase activity at 2 days post-transfection, at which point the harvested medium had been on the cells for 24 h. Bars indicate the SD of three transfections, representing the mean of three aliquots per transfection. WT and M1 refer to the WT and mutant sequences in Fig. 2(c) and GAD is a polymerase mutant. (b) Schematic diagram indicating single substitutions (pink) that, separately, are predicted to disrupt stem–loop ISL2 (M3 and M5 mutants) and, when combined, are predicted to restore the stem–loop structure but with a reversed apical base pairing (M35 mutant). (c) S10-3 cells were transfected with the indicated virus genomes expressing luciferase and aliquots of medium harvested at 5 days post-transfection were assayed for luciferase activity, at which point the harvested medium had been on the cells for 72 h. Bars indicate the SD of three transfections, representing the mean of three aliquots per transfection.
