Abstract
Melanoma is a malignant tumor with high invasive and metastatic properties. Though radiation is the major therapy for melanoma, its radio-resistance has been shown to severely influence the clinical outcome. So it is imperative to enhance the sensitivity of uveal melanoma cells to radiotherapy. Previously, we found that the cell cycle of 92-1 uveal melanoma cells was suspended and remained unchanged for up to 5 days after exposure to 10 Gy of X-rays, which might be relevant to the high radio-sensitivity of 92-1 cells. To further investigate the cell cycle suspension-associated proteins, we employed two analyses with stable isotope labeling with amino acids in cell culture technology and two-dimensional liquid chromatography tandem mass spectrometry. Cells were incubated for 15 h or 48 h after irradiation with 10 Gy of X-rays. We identified a total of 737 proteins at 15 h (Group A) and 530 proteins at 48 h post-irradiation (Group B). The gene ontology biological pathway was used to obtain a systems level view of proteome changes in 92-1cells under cell cycle suspension. We further selected the significantly changed proteins for investigation of their potential contribution to cell cycle suspension, growth arrest and cell senescence. These proteins are involved in the cell cycle, stress response, glycolysis and the tricarboxylic acid cycle, etc. Our study expected to reveal potential marker proteins associated with cell suspension induced by irradiation, which might contribute to understanding the mechanism beyond the cell cycle suspension.
Keywords: radiation, uveal melanoma, 2D-LC-MS/MS, GO biological pathway
INTRODUCTION
Melanoma is a malignant tumor with rapid metastasis and low levels of spontaneous apoptosis compared with other tumor cell types [1–3]. At present, radiotherapy has become the major treatment for most cases of uveal melanomas (UMs) [4, 5]. However, some UM cells are found to be radio-resistant to episcleral plaque charged-particle radiotherapy even at very high doses (85–100 Gy) [6–8]. In fact, data in vitro show that melanoma cells have high levels of damage repair at conventional fractionation doses and increased cell death with larger doses per fraction [9]. A defective p53 (TP53) gene may play a significant role in the radio-resistance of some human melanoma cell lines [10]. Some studies also showed that the melanoma cells were less sensitive to X-ray irradiation if they had a p16 mutation [11, 12]. Moreover, high doses of radiation can increase the risk of injury to normal tissues and lead to side-effects. So it is imperative to develop novel insights to enhance the sensitivity of UM cells to radiotherapy.
Senescence of tumor cells can be induced by irradiation or chemotherapeutic drugs [13]. It has been demonstrated that senescent fibroblasts not only permanently exit from cell cycle traverse, but also resist cell death [14]. Generally, senescent cells are unable to override G1 arrest and have a late G1-phase DNA content [15]. In our previous study, we found that irradiation induced cell cycle suspension and the cell cycle distribution remained unchanged for up to 5 days in 92-1 uveal melanoma cells after exposure to 10 Gy of X-rays. Furthermore, the arrest cells displayed a senescence-like phenotype but there was no subsequent apoptotic cell death from 3 days after treatment [16]. This cell cycle suspension evidently contributes to the high radio-sensitivity of this cell line since it blocks cell division and growth. Thus, it is of great importance to identify cell cycle suspension-associated molecular markers.
In recent years, two-dimensional liquid chromatography tandem mass spectrometry (2D-LC-MS/MS) has been generally used to detect a large quantity of proteins, which is important to aid understanding of complex molecular networks and allow investigation of the biological effects induced by irradiation [17–19]. More recently, combined analysis of proteomic and transcriptomic profiling have mainly concentrated on cutaneous melanomas [20]. Han and his colleagues employed liquid chromatography-tandem mass spectrometry (LC-MS/MS) analysis and identified 110 unique proteins in metastatic melanoma correlated with cell death, growth and tumorigenesis. In addition, most abundantly changed proteins were mapped to the cellular networks that are closely associated with the known oncogenes (JNK, c-myc and N-myc) and tumor suppressor genes (p53 and TGF -β) [21].
In this study, we employed 2D-LC-MS/MS, together with stable isotope labeling with amino acids in cell culture (SILAC), to quantitatively assess the changes in protein expression in 92-1 cells after 15 h and 48 h, respectively, of 10 Gy radiation. Our objective is to identify potential proteins contributing to radiation-induced cell cycle suspension in 92-1 cells.
MATERIALS AND METHODS
Cell culture
Human UM cell line (92-1) was kindly provided by Martine J. Jager and H. Monique H. Hurks (Leiden University Medical Center, Leiden, the Netherlands). For the forward SILAC experiments, the control cells were cultured in Dulbecco's Modified Eagle's Medium containing ‘heavy’ 13C615N4-L-arginine and 13C615N2-L-lysine, while 15 h and 48 h post-irradiation group cells were maintained in normal ‘light’ medium containing 12C614N4-L-arginine and 12C614N2-L-lysine. To improve the reliability of the experiment and reduce the probability of false positives, we exchanged labeling of isotopes between the control and the treatment. For reverse SILAC experiments, the cells cultured in the ‘heavy’ medium were treated with irradiation, whereas control cells were maintained in ‘light’ medium. All cells were kept in a humidified atmosphere of 95% air and 5% CO2 at 37°C. A total of 5 × 10⁴ cells were seeded in 25 cm2 culture flasks for 2 days before irradiation, which resulted in < 70% confluence at the time the cells were irradiated. As a matter of convenience for quantitative analysis of the differences in protein expression level among the control group, the 15-h post-irradiation group and the 48-h group, we defined the 15-h post-irradiation group/control group as Group A, and the 48-h post-irradiation group/control group as Group B, respectively.
Irradiation
After 2 days of incubation, cells were irradiated at room temperature with 10 Gy of X-rays. The X-ray generator (Shimadzu, Tokyo, Japan) was operated at 200 kVp and 20 mA with 0.5 mm A1 and 0.5 mm Cu filters. The dose rate was 1 Gy/min. Then after 15 h or 48 h of further incubation, cells for SILAC assay were washed three times with pre-chilled phosphate buffered saline.
Sample preparation
Cells were suspended in 8 M urea and sonicated for cell lysis at 4°C. After centrifugation for 30 min at 20 000 g, the supernatants were collected and kept at–80°C for further analysis. Protein concentrations were measured using the Bradford method. Extracted protein samples from heavy and light were combined in a 1:1 ratio.
2D-LC-MS/MS analysis
The tryptic peptide mixtures were analyzed with 2D-LC coupled to a linear ion trap mass spectrometer LTQ-Orbitrap XL (Thermo Electron, San Jose, CA, USA). For each experiment, the peptide mixtures (from about 100 μg proteins) were pressure-loaded onto a biphasic silica capillary column (250 μm inner diameter) packed with 3 cm of C18 resin (SP-120-3-ODS-A, 5 µm; the Great Eur-Asia Sci&Tech Devolopment, Beijing, China) and 3 cm of strong cation exchange resin (SCX Luma, 5 µm, 100 Å; Phenomenex, Torrance, CA, USA).
The buffers used were 0.1% formic acid (FA, buffer A), 80% acetonitrile (ACN)/0.1% FA (buffer B) and 600 mM ammonium acetate/5% ACN/0.1% FA (buffer C). Mass spectrum (MS) data were searched using the SEQUEST algorithm (Ver. 2.8) against the human database, which was released on 27 May 2008, and contains 37 869 protein sequences. The database was reversed and attached to estimate the false discovery rate (FDR). All searches were performed using a precursor mass tolerance of 3 Da calculated using average isotopic masses. Fixed modification was set for cysteine with the addition of 57.052 Da to represent cysteine carboxyamidation. Variable modification was set for methionine with the addition of 15.999 Da to represent methionine oxidation. Other variable modification for SILAC heavy labeling was set for arginine and lysine with the addition of 10.0083 Da and 8.0142 Da, respectively. A fragment ion mass tolerance of 1 Da was used. Enzyme cleavage specificity was set to trypsin and no more than two missed cleavages were allowed. The SEQUEST outputs were then analyzed using the commercial software Thermo Electron BioWorks (Rev. 3.3.1).
Data analysis and bioinformatic assay
The database was reversed and attached to estimate the false discovery rate (FDR). Bioworks was used to analyse and filter peptide identifications, i.e. Xcorr ≥1.8 (z = 1), 2.2 (z = 2), 3.5 (z = 3), Sp ≥500, Rsp ≥5, proteins with numbers of peptide ≥2 and Consensus score ≥10. An open source tool called trans-proteomic pipeline (Ver. 4.5.2) could perform these steps: PeptideProphet validates peptides assigned to MS/MS spectra [22], the automated statistical analysis on protein (ASAP) ratio program quantitates peptides [23] and proteins in differentially labeled samples and ProteinProphet [24] infers sample proteins. Quantification of each protein's relative expression for light and heavy labels was calculated using the ASAP ratio program. By default, the ASAP ratio was displayed as a ratio of heavy/light (ratio H/L) for SILAC experiments. ASAP ratio for the reverse experiment was the ratio of ‘heavy’ irradiated protein/'light' control protein, and the ASAP ratio for the forward experiment was the ratio of ‘heavy’ control protein/‘light’ irradiated protein. So, for forward SILAC analysis, the reciprocal of the ASAP ratio was usually used. A significant difference in protein expression was considered as >2 or <0.5. In addition, the minimum peptide length was considered as seven and the filtered out result was set at a PeptideProphet probability of 0.95. The PANTHER classification system was used for protein sorting (http://www.pantherdb.org) [25].
Western blot analysis
Cells were collected and lysed in appropriate amounts of lysis buffer (Biyuntian, Nanjing, China). Samples were centrifuged at 10 000 g, 4°C for 15 min and the concentration of total protein was determined from the supernatants using a bicinchoninic acid protein assay kit (Pierce, Rockford, IL, USA). Thereafter, samples were mixed with sample buffer (250 mM Tris HCl, 5% β-mercaptoethanol, 50% glycerol, 10% SDS, 0.5% bromophenol blue), boiled for 5 min and equal amounts of protein (30 μg) were separated with 10% SDS-PAGE gels (Bio-Rad, Tokyo, Japan). PVDF membranes (GE healthcare, Beijing, China) were rinsed in 100% methanol for 10 s and subsequently placed in transfer buffer (48 mM Tris, 39 mM Glycine, 0.037% SDS, 20% methanol) for 5 min. Blotting was performed at 120 V for 1.5 h in a wet transfer instrument (Bio-Rad, Hercules, CA, USA). The membranes were blocked for 1 h in blocking buffer (5% skim milk) and incubated with primary antibodies for 2 h (the primary antibodies to Ku70, Ku80 and β-actin were purchased from Santa Cruz). The membranes were then washed three times with phosphate buffered saline containing 0.1% Tween20 and incubated with secondary antibody for 1 h. Finally, following washing of the membranes, protein bands were visualized using the enhanced chemiluminescence system (Amersham-Buchler, Braunschweig, Germany) and exposed to X-ray medical film (Kodak, Tokyo, Japan).
RESULTS
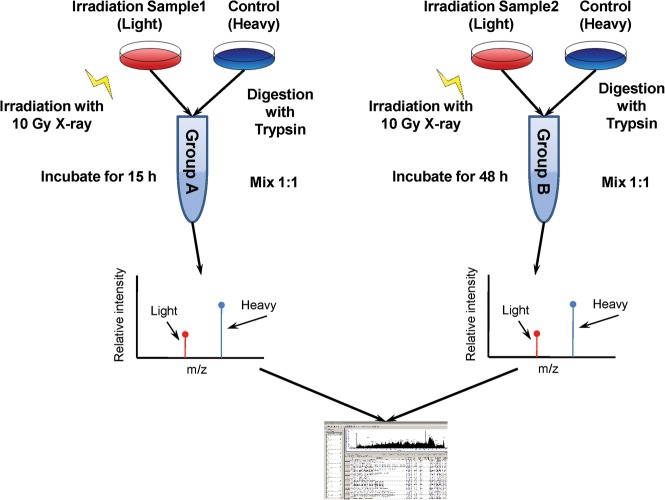
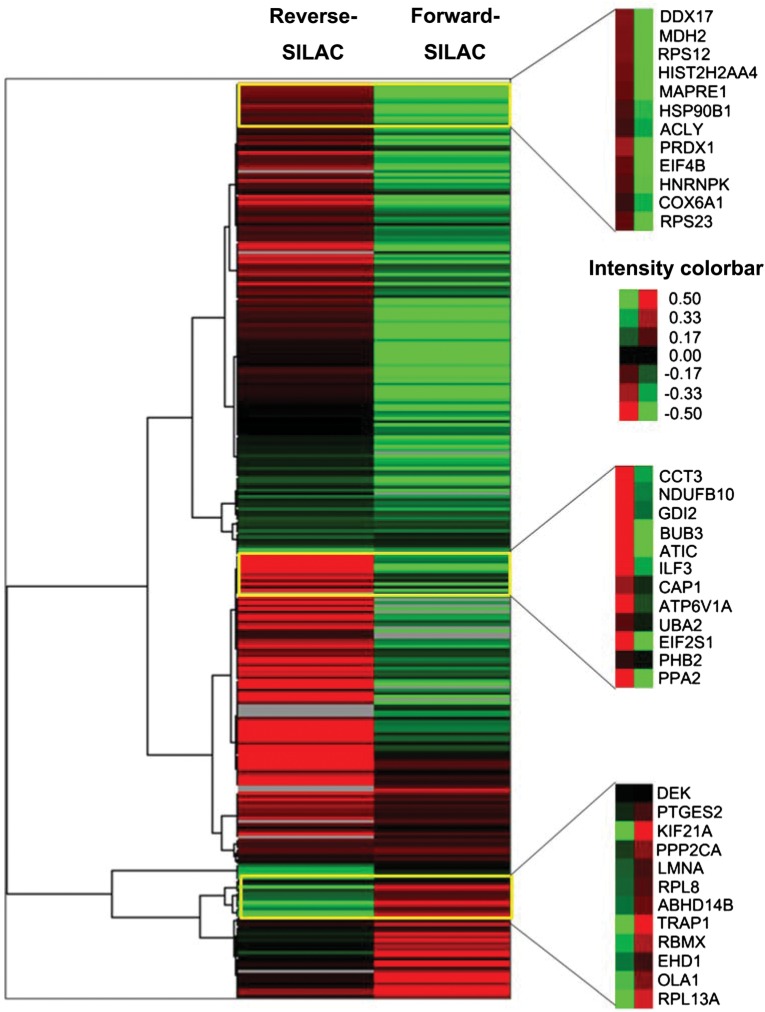
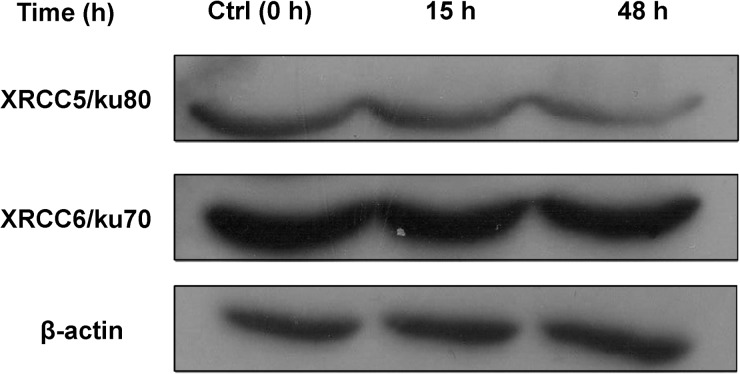
We employed SILAC technology and 2D-LC-MS/MS to quantify radiation-induced differential protein expression in 92-1 cells. An overview of the workflow for quantitative analysis of protein expression is shown in Fig. 1. To obtain reliable results, both forward and reverse SILAC labeling were performed in Group A. Figure 2 shows the heat map for the proteins identified with changed expression levels in both forward and reverse SILAC experiments, which displays clearly repeatability in biological replicates. In addition, western blots were performed for two proteins including XRCC6/Ku70and XRCC5/Ku80 to validate the SILAC-MS results in both Group A and B. Western blot results of the two proteins at 15 h and 48 h post-radiation are shown in Fig. 3, and a comparison of the protein ratio obtained from the western blot and the SILAC-MS results is shown in Table 1.
Fig. 1.
The work flow of protein identification and quantification. For the SILAC experiments, the control cells were cultured in Dulbecco's Modified Eagle's Medium containing ‘heavy’ 13C615N4-L-arginine and 13C615N2-L-lysine, while irradiation group cells were maintained in normal ‘light’ medium containing 12C614N4-L-arginine and 12C614N2-L-lysine. The mixtures of Group A and Group B were analyzed by mass spectrum and then explained by SEQUEST.
Fig. 2.
Heat map generated from forward and reverse SILAC data in Group A. Reverse SILAC means that sham control cells were labeled with ‘light’ amino acids while irradiated cells with ‘heavy’ amino acids. Forward SILAC means that irradiated cells were labeled with ‘light’ amino acids while control cells were labeled with ‘heavy’ amino acids.
Fig. 3.
The expression level changes of XRCC5 and XRCC6 by western blot analysis at 15 h and 48 h post-irradiation.
Table 1.
Comparisons of the protein ratio obtained from western blots and SILAC-MS analysis
| Protein name | Normalized ratio of western blot |
Mean ASAP ratio of SILAC |
||
|---|---|---|---|---|
| 15 h/Ctrl | 48 h/Ctrl | 15 h/Ctrl | 48 h/Ctrl | |
| XRCC5 | 0.80 ± 0.21 | 0.68 ± 0.18 | 0.86 ± 0.24 | 0.49 ± 0.25 |
| XRCC6 | 0.71 ± 0.19 | 0.66 ± 0.04 | 0.64 ± 0.54 | 0.77 ± 0.11 |
Gray intensity analysis for western blot was measured with Photoshop CS. The value was then normalized using the levels of β-actin. Average normalized value was presented from three independent experiments. MS = mass spectrum.
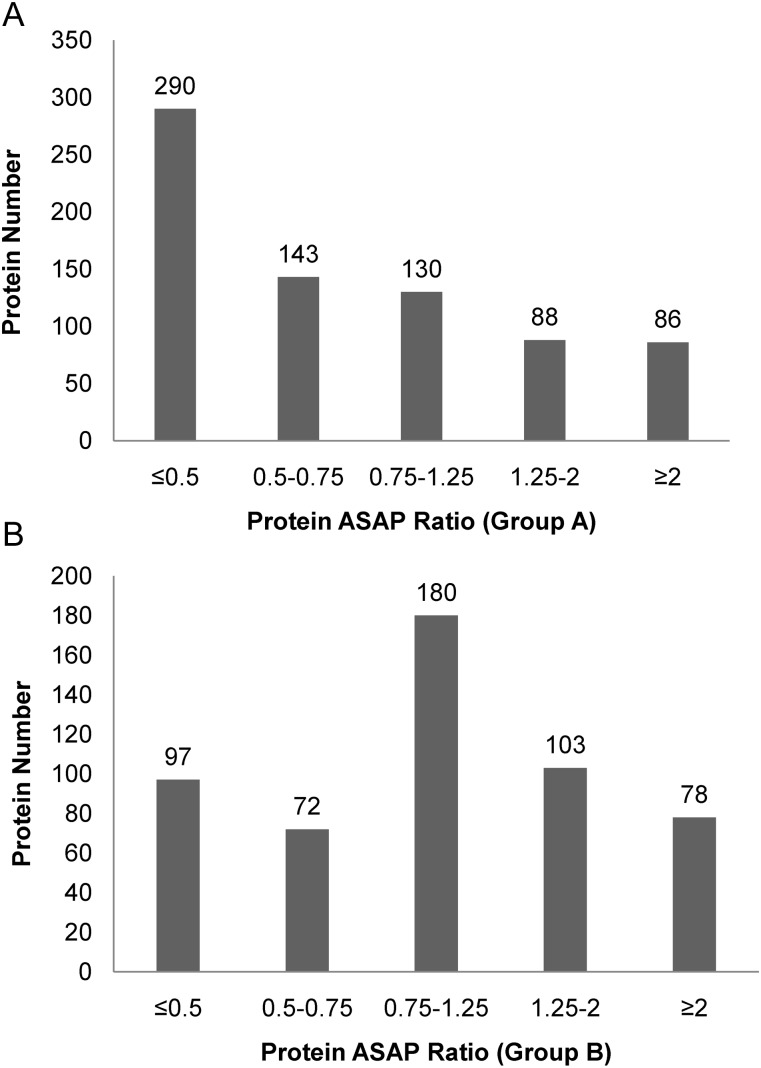
To remove false positive identifications, we excluded single peptide and non-applicable quantitative proteins. A total of 737 proteins were unambiguously identified in Group A, of which 290 proteins were down-regulated more than two-fold while 86 were up-regulated more than two-fold. In Group B, 530 proteins were identified, among which 97 and 78 were down- and up-regulated more than two-fold, respectively. Details of all quantified proteins can be found in Supplementary Table 1 and Supplementary Table 2. The distribution of changes in protein expression levels induced by X-ray irradiation is displayed in Fig. 4A. The proteins identified could be separated into five groups: proteins whose level decreased ≥2-fold (ASAP Ratio ≤0.5), decreased between 1.25- and 2-fold (0.5 < ASAP Ratio ≤ 0.75), increased ≥2-fold (ASAP Ratio ≥ 2), increased between 1.25- and 2-fold (1.25 ≤ ASAP Ratio < 2), and unchanged (0.75 < ASAP Ratio < 1.25) [26–27].
Fig. 4A.
Distribution of protein ASAP ratio (irradiated/control) for the quantified proteins in Group A and Group B. The distribution of proteins quantified by ASAP ratio and the threshold of fold change was cut off ± 1.25.
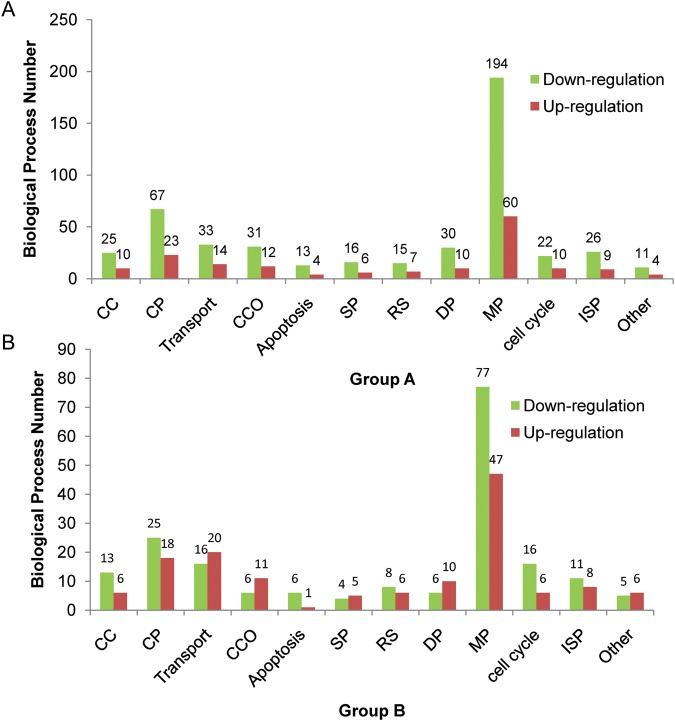
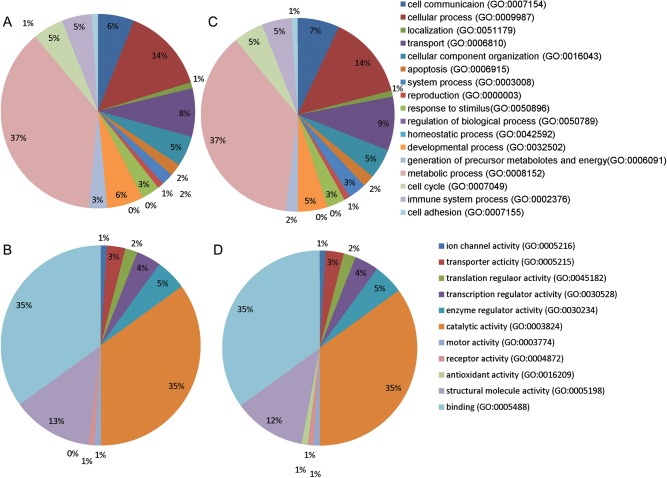
These proteins were analyzed by gene ontology (GO) from the PANTHER Database (http://www.pantherdb.org/) for protein categorization according to biological process and molecular function. Classification of proteins in Group A and Group B is displayed in Fig. 4B. GO analysis of the biological process indicated that about 37%, 5.3% and 5.2% of proteins belonged to the metabolic process, cell cycle and immune system process categories, respectively. And proteins falling into molecular function categories of catalytic activity, translation regulator activity and transporter activity were 35%, 2% and 3%, respectively. Figure 4C shows the distribution of proteins down- or up-regulated by two-fold or more in each biological process. In Group A, the number of down-regulated proteins was obviously more than the number of up-regulated proteins in all biological processes, especially in metabolic processes, immune system processes, apoptosis, developmental processes and cell cycle at 15 h post-irradiation. Interestingly, in Group B, lots of down-regulated proteins changed to up-regulation, and some up-regulated and unchanged proteins showed continuous up-regulation at 48 h post-irradiation. GO analysis of the cellular process at 48 h post-irradiation indicated that the number of up-regulated proteins was larger than the down-regulated proteins in transport processes, cellular component organization, system processes and developmental processes.
Fig. 4C.
Distribution of proteins down- and up-regulated by two-fold or more in each biological process. The abbreviations in the graph are as follows: cell communication (CC), cellular process (CP), cellular component organization (CCO), system process (SP), response to stimulus (RS), developmental process (DP), metabolic process (MP), immune system process (ISP).
Fig. 4B.
Gene ontology (GO) analysis of the proteins identified in group A and Group B. Pie charts (A) and (C) show proteins classified on the basis of biological processes for Group A and Group B, respectively. Pie charts (B) and (D) show proteins classified according to molecular function for Group A and Group B, respectively.
Among the quantified proteins, 399 could be quantified in both Group A and B. To catalog our data for further analysis, we divided these differentially expressed proteins into eight categories: 79 proteins down-regulated in both Group A and B (down-down), 111 down-regulated in Group A but unchanged in Group B (down-unchanged), 72 down-regulated in Group A while up-regulated in Group B (down-up), 32 unchanged in Group A and up-regulated in B (unchanged-up), 20 unchanged in Group A but down-regulated in B (unchanged-down), 22 up-regulated in Group A while down-regulated in Group B (up-down), 25 up-regulated in A while unchanged in B (up-unchanged) and 25 proteins up-regulated in both Group A and B (up-up) (Supplementary Table 3).
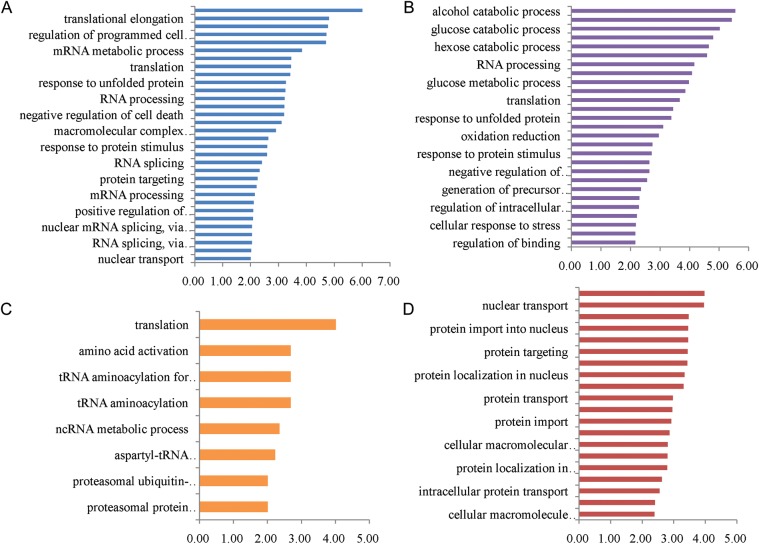
From the MS data, the proteins with significant changes in Group A and Group B were reserved to analyze the biological process. We selected proteins including down-down, down-up, up-down and up-up groups to analysis with database for annotation, visualization and integrated discovery [28, 29]. Supplementary Table 4 shows a complete list of the enriched GO biological pathways for proteins with differential expression levels. The biological pathways for proteins with down-regulated expression within 15 h and 48 h post-irradiation are mainly involved in cell redox homeostasis, translation elongation, regulation of programmed cell death and apoptosis, regulation of the cell cycle and chromatin assembly, etc. (Fig. 5A). Enriched biological pathways for proteins identified with down-up expression include the metabolism of glycolysis and oxidative phosphorylation, the tricarboxylic acid cycle, aerobic respiration and the citrate metabolic process (Fig. 5B). The biological pathways for proteins with up-down expression include translation, amino acid activation and the RNA metabolic process (Fig. 5C). Enriched biological pathways for proteins identified with up-regulated expression in 15 h and 48 h post-irradiation are mainly involved in protein transport, cellular protein localization, protein import into the nucleus and the fibrinolysis process (Fig. 5D). From Fig. 5A, we found the proteins down-regulated in 15 h and 48 h were closely associated with a series of important cellular events that include cell death and apoptosis. The down-down expression proteins would play vital roles in cell suspension. The detailed biological process chart is shown in Supplementary Fig. 1. Table 2 gives a partial list of overlap proteins that displayed significant changes in the expression level of Group A or B. These proteins may be more likely to play major roles in the cell cycle, metabolism, the immune system process and translation after treatment.
Fig. 5.
Enriched biological pathways for the overlap proteins identified in Group A and Group B. Different biological pathway terms for proteins with changed expression levels analyzed by Database for Annotation, Visualization and Integrated Discovery. (A) Biological pathway terms associated with down-regulated proteins at 15 h and 48 h post-irradiation (down-down) (B) Proteins with down-regulated expression at 15 h then unchanged or up-regulated at 48 h post-irradiation (down-up). (C) Proteins with up-regulated expression at 15 h then unchanged or down at 48 h post-irradiation (up-down). (D) Proteins with up-regulated expression in 15 h and 48 h post-irradiation (up-up). Selection of significantly enriched terms (Benjamini-Hochberg P < 0.01(–log (P-value) >2.0)) was shown.
Table 2.
Partial list of the overlap proteins identified with more than two-fold changes in one SILAC experiment at least
| NP number | Protein name | Gene name | 15 h mean ASAP ratio | 48 h mean ASAP ratio |
|---|---|---|---|---|
| Cell cycle-related proteins | ||||
| NP_036457.1 | microtubule-associated protein | MAPRE1 | 0.47 | 0.17 |
| NP_001099008.1 | Myb-binding protein 1A | MYBBP1A | 3.54 | 0 |
| NP_631946.1 | nucleosome assembly protein 1-like 1 | NAP1L1 | 0.32 | 0.73 |
| NP_005960.1 | nucleosome assembly protein 1-like 4 | NAP1L4 | 0.18 | 0 |
| NP_002625.1 | Prohibitin 1 | PHB1 | 0.69 | 0.41 |
| NP_009204.1 | prohibitin 2 | PHB2 | 0.88 | 0.1 |
| NP_008835.5 | DNA-dependent protein kinase catalytic subunit | PRKDC | 0.67 | 0.74 |
| NP_002806.2 | proteasome 26S non-ATPase subunit 11 | PSMD11 | 0.33 | 0.82 |
| NP_002802.2 | 26S proteasome non-ATPase regulatory subunit 7 | PSMD7 | 0.48 | 0.82 |
| NP_005611.1 | Protein S100-A11 | S100A11 | 0.77 | 0.54 |
| NP_005110.2 | thyroid hormone receptor associated protein 3 | THRAP3 | 0.67 | 0.42 |
| NP_003395.1 | 14-3-3 protein beta/alpha | YWHAB | 0.33 | 0.18 |
| NP_006752.1 | 14-3-3 protein epsilon | YWHAE | 0.62 | 0.33 |
| NP_056060.2 | Ankyrin repeat and SAM domain-containing protein 1A | ANKS1A | 1.04 | 0.47 |
| Immune system process-related proteins | ||||
| NP_003320.2 | Thioredoxin | TXN | 0.35 | 0.04 |
| NP_110437.2 | Thioredoxin domain-containing protein 5 | TXNDC5 | 0.55 | 0.45 |
| NP_054817.2 | peroxiredoxin 3 | PRDX3 | 0.36 | 0.36 |
| NP_036226.1 | peroxiredoxin 5 | PRDX5 | 0.58 | 0 |
| NP_057376.2 | TNF receptor-associated protein 1 | TRAP1 | 4.04 | 0.49 |
| NP_006358.1 | adenylyl cyclase-associated protein | CAP1 | 0.67 | 0.53 |
| NP_000601.3 | CD44 antigen | CD44 | 0.53 | 0.56 |
| NP_002005.1 | FK506-binding protein 4 | FKBP4 | 0.25 | 0.41 |
| NP_003290.1 | heat shock protein 90kDa beta | HSP90B1 | 0.56 | 0.9 |
| NP_005337.2 | Heat shock 70 kDa protein 1A/1B | HSPA1B | 0.53 | 0 |
| NP_006588.1 | heat shock 70kDa protein 8 | HSPA8 | 0.41 | 0.33 |
| NP_004125.3 | heat shock 70kDa protein 9 | HSPA9 | 0.73 | 0.51 |
| NP_001531.1 | heat shock 27kDa protein 1 | HSPB1 | 0.71 | 2.05 |
| NP_002147.2 | heat shock protein 60 kDa | HSPD1 | 0.54 | 0.43 |
| NP_006635.2 | heat shock protein 105 kD | HSPH1 | 0.82 | 1.18 |
| NP_002297.2 | galectin 3 | LGALS3 | 0.67 | 0.56 |
| NP_110437.2 | X-ray repair cross-complementing protein 5 | XRCC5/ku86 | 0.86 | 0.49 |
| NP_001460.1 | X-ray repair cross-complementing protein 6 | XRCC6/ku70 | 0.64 | 0.77 |
| Glycolysis-related proteins | ||||
| NP_002037.2 | glyceraldehyde-3-phosphate dehydrogenase | GAPDH | 0.30 | 1.8 |
| NP_002291.1 | lactate dehydrogenase B | LDHB | 0.54 | 1.53 |
| NP_000166.2 | glucose phosphate isomerase | GPI | 0.68 | 1.24 |
| NP_000282.1 | phosphoglycerate kinase 1 | PGK1 | 0.62 | 1.1 |
| NP_000356.1 | Triosephosphate isomerase | TPI1 | 0.65 | 1.09 |
| NP_005557.1 | lactate dehydrogenase A | LDHA | 0.56 | 1.01 |
| NP_002645.3 | pyruvate kinase | PKM2 | 0.64 | 0.83 |
| NP_001419.1 | enolase 1 | ENO1 | 0.39 | 0.53 |
| NP_908930.1 | aldolase A | ALDOA | 0.39 | 0.43 |
| TCA cycle and electron transport chain proteins | ||||
| NP_061820.1 | cytochrome c | CYCS | 0.30 | 0.96 |
| NP_000099.2 | dihydrolipoamide dehydrogenase | DLD | 0.46 | 999 |
| NP_001089.1 | aconitase 2 | ACO2 | 0.34 | 2.63 |
| NP_004159.2 | succinate dehydrogenase complex, subunit A | SDHA | 0.89 | 2.06 |
| NP_001087.2 | ATP citrate lyase isoform 1 | ACLY | 0.60 | 1.68 |
| NP_036475.3 | nicotinamide nucleotide transhydrogenase | NNT | 0.71 | 1.33 |
| NP_000134.2 | fumarate hydratase | FH | 0.47 | 1.04 |
| NP_005909.2 | mitochondrial malate dehydrogenase | MDH2 | 0.41 | 0.87 |
| NP_004994.1 | Acyl carrier protein | NDUFAB1 | 0.30 | 2.89 |
| NP_003356.2 | Cytochrome b-c1 complex subunit 1 | UQCRC1 | 0.66 | 0.92 |
| NP_001677.2 | ATP synthase | ATP5B | 0.61 | 0.85 |
| NP_003357.2 | Cytochrome b-c1 complex subunit 2 | UQCRC2 | 0.57 | 0.83 |
| Other | ||||
| NP_001015.1 | ribosomal protein S21 | RPS21 | 0.90 | 0.23 |
| NP_000979.1 | ribosomal protein L27 | RPL27 | 0.55 | 0.38 |
| NP_056474.2 | ribosomal L1 domain containing 1 | RSL1D1 | 0.40 | 0.41 |
| NP_000958.1 | ribosomal protein L3 | RPL3 | 0.88 | 0.44 |
| NP_002286.2 | ribosomal protein SA | RPSA | 0.87 | 0.51 |
| NP_150254.1 | ribosomal protein L13 | RPL13 | 1.48 | 0.55 |
| NP_006351.2 | eukaryotic translation initiation factor 3 | EIF3M | 0.59 | 0.86 |
| NP_001016.1 | ribosomal protein S23 | RPS23 | 0.47 | 0.89 |
| NP_001408.2 | eukaryotic translation initiation factor 4B | EIF4B | 0.45 | 0.9 |
| NP_004437.2 | glutamyl-prolyl tRNA synthetase | EPRS | 0.48 | 0.91 |
| NP_001002.1 | ribosomal protein S7 | RPS7 | 0.62 | 0.94 |
| NP_000959.2 | ribosomal protein L4 | RPL4 | 0.68 | 1.08 |
| NP_004085.1 | Eukaryotic translation initiation factor 2 subunit 1 | EIF2S1 | 0.10 | 1.13 |
| NP_002939.2 | ribosomal protein L15 | RPL15 | 0.34 | 1.19 |
| NP_444505.1 | ribosomal protein P0 | RPLP0 | 0.17 | 1.55 |
| NP_000996.2 | ribosomal protein S3 | RPS3 | 0.53 | 1.59 |
| NP_000960.2 | ribosomal protein L5 | RPL5 | 0.37 | 3.65 |
| NP_001393.1 | Elongation factor 1-alpha 1 | EEF1A1 | 0.50 | 0.27 |
| NP_001395.1 | Elongation factor 1-gamma | EEF1G | 0.60 | 1.29 |
| NP_006102.2 | acetyl-coenzyme A acyltransferase 2 | ACAA2 | 0.84 | 0.45 |
| NP_005989.3 | chaperonin containing TCP1, subunit 3 | CCT3 | 0.30 | 1.32 |
| NP_036205.1 | chaperonin containing TCP1, subunit 5 | CCT5 | 0.50 | 1.43 |
| NP_001753.1 | chaperonin containing TCP1, subunit 6A | CCT6A | 0.60 | 0.91 |
| NP_006420.1 | chaperonin containing TCP1, subunit 7 | CCT7 | 0.39 | 999 |
| NP_006576.2 | chaperonin containing TCP1, subunit 8 | CCT8 | 0.67 | 0.56 |
| NP_005498.1 | cofilin 1 | CFL1 | 0.23 | 0.9 |
| NP_004081.1 | dual specificity phosphatase 3 | DUSP3 | 0.03 | 0.06 |
| NP_004437.2 | glutamyl-prolyl tRNA synthetase | EPRS | 0.48 | 0.91 |
| NP_006699.2 | glyoxalase I | GLO1 | 0.49 | 1.07 |
| NP_001035807.1 | Histone H2A type 2-A | HIST2H2AA4 | 0.43 | 0.95 |
| NP_036350.2 | Interleukin enhancer-binding factor 3 | ILF3 | 0.27 | 3.65 |
| NP_002406.1 | macrophage migration inhibitory factor | MIF | 0.37 | 1.02 |
| NP_005372.2 | nucleolin | NCL | 0.16 | 0.86 |
| NP_683877.1 | proteasome alpha 1 subunit | PSMA1 | 0.58 | 0.98 |
| NP_002788.1 | proteasome beta 5 subunit | PSMB5 | 0.62 | 4.13 |
| NP_006494.1 | proteasome 26S ATPase subunit 4 | PSMC4 | 0.54 | 0.77 |
| NP_002806.2 | proteasome 26S non-ATPase subunit 11 | PSMD11 | 0.33 | 0.82 |
| NP_002825.3 | protein tyrosine phosphatase, non-receptor type 11 | PTPN11 | 0.22 | 1.95 |
| NP_006316.1 | ras-related nuclear protein | RAN | 0.54 | 0.51 |
| NP_005057.1 | splicing factor proline/glutamine rich | SFPQ | 0.78 | 1.71 |
| NP_004243.1 | solute carrier family 9 | SLC9A3R1 | 0.00 | 0.36 |
| NP_005753.1 | tripartite motif-containing 28 protein | TRIM28 | 0.47 | 0.77 |
| NP_003339.1 | ubiquitin-conjugating enzyme E2N | UBE2N | 0.49 | 2.55 |
In Table 2, ‘0’ indicates that the peptides were not detected in the irradiated cells, but ‘999’ indicates that the peptides were not detected in the control cells. TCA = tricarboxylic acid.
DISCUSSION
In a previous study, we showed that cell cycle suspension accompanied by G2 arrest was induced in 92-1 cells at 15 h after exposure to 10 Gy X-rays, and most cells gradually presented the features of cellular senescence but no subsequent apoptotic response in the 5 days following after irradiation [16] (the summarized result is shown in Supplementary Fig. 2). The primary goal of this study was to identify proteins that contribute to radiation-induced cell cycle suspension, which is relevant to the high radio-sensitivity of the 92-1 UM cell line. To obtain reliable quantification results, we conducted two biology replications and two technical replications. To screen the significantly changed proteins, we considered those proteins that greatly coincided in two experiments.
Radiation-induced down-regulation of cell cycle-related proteins
Ten-gray X-ray treatment led to a systematic down-regulation of several important proteins involved in the cell cycle, DNA replication and chromosome stability within 48 h post-irradiation (Fig. 5A, Table 2). MAPRE1/EB1 is a microtubule-associated protein that interacts with the colorectal adenomatous polyposis coli tumor-suppressor protein and plays important roles in regulating microtubule dynamics, cell polarity and chromosome stability [30]. As a transcription factor, the nuclear protein NAP1L1 is involved in chromatin assembly and DNA replication and is up-regulated in hepatoblastomas [31]. It has been suggested that nuclear NAP1L1 in dividing cells influences the expression of proliferative genes, and increased expression of NAP1L1 may be related to the progression of cell growth. NAP1L4 in neural stem cells can also contribute to the phenotype of higher cell proliferation observed in the Nap1L2 mutant [32]. In our study, NAP1L4 and NAP1L2 were down-regulated both 15 h and 48 h post-irradiation. S100A11 protein has been shown to be overexpressed in many different types of human cancer, indicating that S100A11 may be involved in growth enhancement, malignant progression of cancer cells, or both [33]. The S100A11 down-regulated by irradiation might be related to inhibited cell growth. The study indicated that depletion of THRAP3, the transcription mediator subunit of THRAP3/TRAP150, by two distinct siRNAs, caused cells to be more sensitive to killing by hydroxyurea (HU) treatment, which induces replication-fork stalling and DNA damage in the S phase [34]. THRAP3 is also found in a complex containing the proteins SNIP1, PNN, BCLAF1 and SKIIP, which regulates Cyclin D1 RNA stability [35]. Another important protein family, known as 14-3-3 protein, has often been found to enhance the activity of proteins with proliferative or survival functions, such as the Raf serine/threonine kinase family [36]. Taken together with our findings, suppression of cell proliferation and growth, DNA repair and chromosome stability through the down-regulation of these proteins would be necessary for cell cycle suspension in 92-1 cells after irradiation. Prohibitins are mainly localized in mitochondria and composed of two subunits, PHB1 and PHB2. These two proteins are assembled into a ring-like macromolecular structure at the inner mitochondrial membrane and implicated in diverse cellular processes: from mitochondrial biogenesis and function to cell death and senescence [37]. Cells deleted for PHB1 and PHB2 showed a roughened cell surface and prolonged cell cycle after fewer divisions compared with the wild type, indicating that the normal ageing process is accelerated in cells lacking the PHB complex [38]. Similarly, lack of PHB1 in endothelial cells resulted in increased levels of reactive oxygen species (ROS), associated with a phenotype resembling senescence [33]. In our previous study, a senescence-like phenotype was observed when cell cycle suspension was induced in 92-1 cells from the third day after being exposed to 10 Gy of rays [16]. Importantly, we observed significantly lower levels of PHB1 and PHB2 in 92-1 cells at 48 h post-irradiation, it was validated that cell senescence could be accompanied by a decreased expression of PHB proteins.
Radiation-induced down-regulation of immunity related proteins
We also observed many proteins involved in redox homeostasis and the stress response displaying a significant decrease in 92-1 cells within 48 h post-irradiation (Fig. 5A, Table 2). The data suggested that 10 Gy of X-rays induced a relatively high degree of oxidative damage of 92-1 cells corresponding to redox imbalance and a weak antioxidant defense system. One report about the effect of oxidative stress on the cell cycle reveals that increases in ROS-induced DNA damage are correlated with cell cycle arrest [39]. In mammals, PRDX3 and PRDX5 are targeted to hydrogen peroxide in the mitochondrial matrix, and this oxidant is implicated in the damage associated with ageing and a number of pathologies [40]. Significant decreases in expression level of TXN, TXNDC5, PRDX3 and PRDX5 were detected, which would probably cause a decline in the antioxidant defense systems and promote cell cycle arrest and senescence.
Alteration in the expression of glycolysis and TCA cycle-related proteins
Several enriched biological pathways from proteins identified with down-regulation at 15 h then unchanged or up-regulated at 48 h post-irradiation are related to the energy-producing metabolic pathway (Fig. 5B). Our data showed two major enzymatic steps in the tricarboxylic acid (TCA) cycle are mediated by aconitase (ACO2) and succinate dehydrogenase (SDHA), both of which have trends for up-regulation at 48 h post-irradiation (ASAP ratio 2.63, 2.06, respectively). Succinate dehydrogenase (complex II of the electron transfer chain (ETC), is the only enzyme that participates in both the TCA cycle and ETC [41]. The product of the TCA cycle is NAD+/NADH, which is involved in promoting cell survival through stimulation of mitochondrial Sir2 proteins [42]. Our data might support the hypothesis that the up-regulated proteins in the TCA cycle contribute to cellular survival through decreasing the damage of oxidative stress.
Radiation-induced alteration in the expression of other important proteins
In our study we detected several ribosomal proteins involved in translation, most of which were down-regulated or unchanged after irradiation. EEF1A1 is considered as a key factor during protein biosynthesis [43], and the protein can positively regulate cell proliferation and cell death [44, 45]. Significant down-regulation of this protein in our data would seem to suppress cell proliferation within 48 h post-irradiation. SFPQ has been shown to exhibit multiple functions in nucleic acid synthesis and processing, including RNA splicing, DNA unwinding, DNA repair and linking RNA transcripts with RNA polymerase II [46]. Lowery et al. show that loss of SFPQ gene function leads to increased cell death throughout the early embryo, suggesting that cell survival requires functional SFPQ protein [47]. The protein was unchanged at 15 h post-irradiation, but was up-regulated at 48 h, which might contribute to RNA transcription and cell survival. DUSP3, an endogenous inhibitor of several mitogen-activated proteins kinase, targets and inactivates ERK and JNK [48]. Continuous down-regulation of DUSP3 might also activate the JNK pathway to promote cell survival.
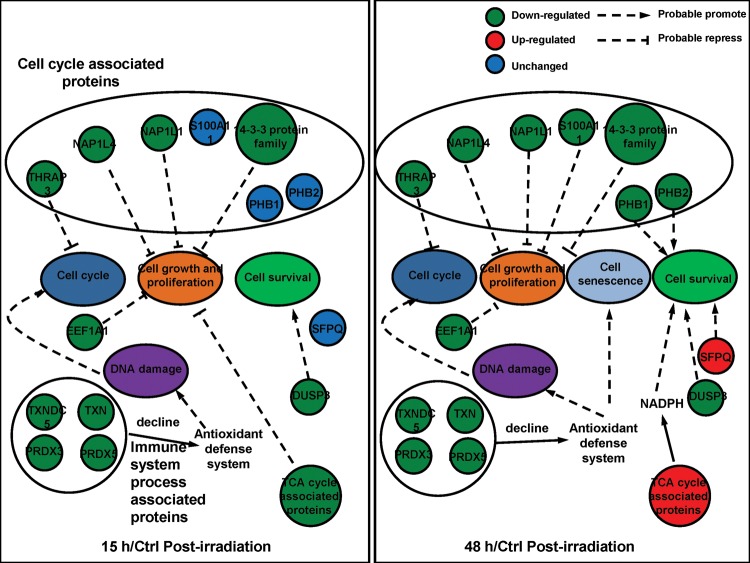
This study demonstrates that quantitative proteomics using SILAC is a useful technique to identify potential protein targets and cellular pathways changes that occur with a cell cycle suspension in 92-1 cells after irradiation. We identified several key molecules participating in the regulation of cell cycle checkpoint and DNA replication, cell growth and senescence. There were significantly decreased levels of cell cycle- and stress response-related proteins that would synergistically suppress cell growth and proliferation and promote cell senescence. Additionally, cell cycle suspension induced by ionizing radiation was a combined effect of many proteins associated with the biological processes of the cell cycle, cell growth and cell survival (Fig. 6). However, some typical cell cycle proteins such as CDKs or cyclins were not shown in this study because of their lower abundance and dynamic modification. In whole proteome analysis, the peptides coming from proteins with lower abundance and dynamic modification were always covered by high abundance and stable peptides from digest proteins and were difficult to detect. Numerous signal pathways and comprehensive regulations participate in the formation of cell cycle suspension post-irradiation, so further studies will be carried out to reveal the proteins playing crucial roles in this regulation.
Fig. 6.
Probable mechanism of cell cycle suspension induced by ionizing radiation. In 15 h/Ctrl group, cell cycle arrest might induced by these down-regulated proteins. In 48 h/Ctrl group, apoptosis was not observed and cell suspension emerged. The significantly changed proteins might play a vital role in cell growth, cell senescence and cell survival.
FUNDING
This work was supported by grants from the Major State Basic Research Development Program of China (973 Program, No. 2010CB834201), the Hundred Talent Program of the Chinese Academy of Sciences (No. 0760140BR0 and T No. 91026005) and the Foundation for Young Talents of Gansu [No. 1208RJYA013].
Supplementary Material
ACKNOWLEDGEMENTS
The authors are grateful to Dr Ryoichi Hirayama, Dr Cuihua Liu, Dr Yoshitaka Matsumoto and Dr Dong Yu of the National Institute of Radiological Sciences, Chiba, Japan, for their kind help in sample preparation and radiation. And many thanks to the Proteomic Core Facility Center of Institute of Biophysics, Chinese Academy of Sciences for providing the authors with technical support.
REFERENCES
- 1.Gray-Schopfer V, Wellbrock C, Marais R. Melanoma biology and new targeted therapy. Nature. 2007;445:851–7. doi: 10.1038/nature05661. [DOI] [PubMed] [Google Scholar]
- 2.Soengas MS, Lowe SW. Apoptosis and melanoma chemoresistance. Oncogene. 2003;22:3138–51. doi: 10.1038/sj.onc.1206454. [DOI] [PubMed] [Google Scholar]
- 3.Miyato Y, Ando K. Apoptosis of human melanoma cells by a combination of lonidamine and radiation. J Radiat Res. 2004;45:189–94. doi: 10.1269/jrr.45.189. [DOI] [PubMed] [Google Scholar]
- 4.Singh AD, Kivelä T. The collaborative ocular melanoma study. Ophthalmol Clin North Am. 2005;18(129–42, ix) doi: 10.1016/j.ohc.2004.11.004. [DOI] [PubMed] [Google Scholar]
- 5.Zhou Y, Song X, Jia R, et al. Radiation-inducible human tumor necrosis factor-related apoptosis-inducing ligand (TRAIL) gene therapy: a novel treatment for radioresistant uveal melanoma. Pigm Cell Melanoma Res. 2010;23:661–74. doi: 10.1111/j.1755-148X.2010.00729.x. [DOI] [PubMed] [Google Scholar]
- 6.Sun Y, Tran BN, Worley LA, et al. Functional analysis of the p53 pathway in response to ionizing radiation in uveal melanoma. Invest Ophth Vis Sci. 2005;46:1561–4. doi: 10.1167/iovs.04-1362. [DOI] [PubMed] [Google Scholar]
- 7.Fernandes BF, Marshall JC, Di Cesare S, et al. Amfenac increases the radiosensitivity of uveal melanoma cell lines. Eye. 2007;22:701–6. doi: 10.1038/sj.eye.6703042. [DOI] [PubMed] [Google Scholar]
- 8.van den Aardweg GJMJ, Naus NC,Verhoeven ACA et al. Cellular radiosensitivity of primary and metastatic human uveal melanoma cell lines. Invest Ophth Vis Sci. 2002;43:2561–5. [PubMed] [Google Scholar]
- 9.Khan NKM, Almasan A, Singh AD, Macklis R. The evolving role of radiation therapy in the management of malignant melanoma. Int J Radiation Oncology Biol Phys. 2011;80:645–54. doi: 10.1016/j.ijrobp.2010.12.071. [DOI] [PMC free article] [PubMed] [Google Scholar]
- 10.Satyamoorthy K, Chehab NH, Waterman MJF, et al. Aberrant regulation and function of wild-type pp53 in radioresistant melanoma cells. Cell Growth Differ. 2000;11:467–74. [PubMed] [Google Scholar]
- 11.Matsumura Y, Yamagishi N, Miyakoshi J, et al. Increase in radiation sensitivity of human malignant melanoma cells by expression of wild-type p16 gene. Cancer Letters. 1997;115:91–6. doi: 10.1016/s0304-3835(97)04714-9. [DOI] [PubMed] [Google Scholar]
- 12.Matsuse M, Saenko V, Sedliarou I, et al. A novel role for thyroid hormone receptor beta in cellular radiosensitivity. J Radiat Res. 2008;49:17–27. doi: 10.1269/jrr.07065. [DOI] [PubMed] [Google Scholar]
- 13.Roninson IB. Tumor cell senescence in cancer treatment. Cancer Res. 2003;63:2705–15. [PubMed] [Google Scholar]
- 14.Marcotte R, Lacelle C, Wang E. Senescent fibroblasts resist apoptosis by downregulating caspase-3. Mech Ageing Dev. 2004;125:777–83. doi: 10.1016/j.mad.2004.07.007. [DOI] [PubMed] [Google Scholar]
- 15.Campisi J, di Fagagna FD. Cellular senescence: when bad things happen to good cells. Nat Rev Mol Cell Biol. 2007;8:729–40. doi: 10.1038/nrm2233. [DOI] [PubMed] [Google Scholar]
- 16.He JP, Li JH, Ye CY, et al. Cell cycle suspension: a novel process lurking in G(2) arrest. Cell Cycle. 2011;10:1468–76. doi: 10.4161/cc.10.9.15510. [DOI] [PubMed] [Google Scholar]
- 17.Mann M. Functional and quantitative proteomics using SILAC. Nat Rev Mol Cell Bio. 2006;7:952–8. doi: 10.1038/nrm2067. [DOI] [PubMed] [Google Scholar]
- 18.Ong SE, Blagoev B, Kratchmarova I, et al. Stable isotope labeling by amino acids in cell culture, SILAC, as a simple and accurate approach to expression proteomics. Mol Cell Proteomics. 2002;1:376–86. doi: 10.1074/mcp.m200025-mcp200. [DOI] [PubMed] [Google Scholar]
- 19.Ong SE, Mann M. Mass spectrometry-based proteomics turns quantitative. Nat Chem Biol. 2005;1:252–62. doi: 10.1038/nchembio736. [DOI] [PubMed] [Google Scholar]
- 20.Stolarczyk L, Olko P, Cywicka-Jakiel T, et al. Assessment of undesirable dose to eye-melanoma patients after proton radiotherapy. Radiat Meas. 2010;45:1441–4. [Google Scholar]
- 21.Han MJ, Wang HA, Beer LA, et al. A systems biology analysis of metastatic melanoma using in-depth three-dimensional protein profiling. Proteomics. 2010;10:4450–62. doi: 10.1002/pmic.200900549. [DOI] [PMC free article] [PubMed] [Google Scholar]
- 22.Keller A, Eng J, Zhang N, et al. A uniform proteomics MS/MS analysis platform utilizing open XML file formats. Mol Syst Biol. 2005;1:2005.0017. doi: 10.1038/msb4100024. [DOI] [PMC free article] [PubMed] [Google Scholar]
- 23.Li X-j, Zhang H, Ranish JA, et al. automated statistical analysis of protein abundance ratios from data generated by stable-isotope dilution and tandem mass spectrometry. Anal Chem. 2003;75:6648–57. doi: 10.1021/ac034633i. [DOI] [PubMed] [Google Scholar]
- 24.Nesvizhskii AI, Keller A, Kolker E, et al. A statistical model for identifying proteins by tandem mass spectrometry. Anal Chem. 2003;75:4646–58. doi: 10.1021/ac0341261. [DOI] [PubMed] [Google Scholar]
- 25.Thomas PD, Kejariwal A, Campbell MJ, et al. PANTHER: a browsable database of gene products organized by biological function, using curated protein family and subfamily classification. Nucleic Acids Res. 2003;31:334–41. doi: 10.1093/nar/gkg115. [DOI] [PMC free article] [PubMed] [Google Scholar]
- 26.Jin J, Hulette C, Wang Y, et al. Proteomic Identification of a Stress Protein, Mortalin/mthsp70/GRP75. Molecular and Cellular Proteomics. 2006;5:1193–204. doi: 10.1074/mcp.M500382-MCP200. [DOI] [PubMed] [Google Scholar]
- 27.Klegeris A, Li J, Bammler TK, et al. Prolyl endopeptidase is revealed following SILAC analysis to be a novel mediator of human microglial and THP-1 cell neurotoxicity. Glia. 2008;56:675–85. doi: 10.1002/glia.20645. [DOI] [PubMed] [Google Scholar]
- 28.Huang DW, Sherman BT, Lempicki RA. Systematic and integrative analysis of large gene lists using DAVID bioinformatics resources. Nat Protocols. 2008;4:44–57. doi: 10.1038/nprot.2008.211. [DOI] [PubMed] [Google Scholar]
- 29.Huang DW, Sherman BT, Lempicki RA. Bioinformatics enrichment tools: paths toward the comprehensive functional analysis of large gene lists. Nucleic Acids Res. 2009;37:1–13. doi: 10.1093/nar/gkn923. [DOI] [PMC free article] [PubMed] [Google Scholar]
- 30.Fu J-F, Hsu H-C, Shih L-Y. MLL is fused to EB1 (MAPRE1), which encodes a microtubule-associated protein, in a patient with acute lymphoblastic leukemia. Genes, Chromosomes and Cancer. 2005;43:206–10. doi: 10.1002/gcc.20174. [DOI] [PubMed] [Google Scholar]
- 31.Nagata T, Takahashi Y, Ishii Y, et al. Transcriptional profiling in hepatoblastomas using high-density oligonucleotide DNA array. Cancer Genet Cytogen. 2003;145:152–60. doi: 10.1016/s0165-4608(03)00065-7. [DOI] [PubMed] [Google Scholar]
- 32.Simon HU, Mills GB, Kozlowski M, et al. Molecular characterization of hNRP, a cDNA encoding a human nucleosome-assembly-protein-I-related gene product involved in the induction of cell proliferation. Biochem J. 1994;297:389–97. doi: 10.1042/bj2970389. [DOI] [PMC free article] [PubMed] [Google Scholar]
- 33.Schleicher M, Shepherd BR, Suarez Y, et al. Prohibitin-1 maintains the angiogenic capacity of endothelial cells by regulating mitochondrial function and senescence. J Cell Biol. 2008;180:101–12. doi: 10.1083/jcb.200706072. [DOI] [PMC free article] [PubMed] [Google Scholar]
- 34.Petermann E, Helleday T. Pathways of mammalian replication fork restart. Nat Rev Mol Cell Biol. 2010;11:683–7. doi: 10.1038/nrm2974. [DOI] [PubMed] [Google Scholar]
- 35.Bracken CP, Wall SJ, Barre B, et al. Regulation of cyclin D1 RNA stability by SNIP1. Cancer Res. 2008;68:7621–28. doi: 10.1158/0008-5472.CAN-08-1217. [DOI] [PMC free article] [PubMed] [Google Scholar]
- 36.Tzivion G, Gupta VS, Kaplun L, et al. 14-3-3 proteins as potential oncogenes. Seminars in Cancer Biology. 2006;16:203–13. doi: 10.1016/j.semcancer.2006.03.004. [DOI] [PubMed] [Google Scholar]
- 37.Artal-Sanz M, Tavernarakis N. Prohibitin and mitochondrial biology. Trends Endocrinol Metab. 2009;20:394–401. doi: 10.1016/j.tem.2009.04.004. [DOI] [PubMed] [Google Scholar]
- 38.Coates PJ, Jamieson DJ, Smart K, et al. The prohibitin family of mitochondrial proteins regulate replicative lifespan. Current Biology. 1997;7:607–10. doi: 10.1016/s0960-9822(06)00261-2. [DOI] [PubMed] [Google Scholar]
- 39.Migliore L, Coppedè F. Genetic and environmental factors in cancer and neurodegenerative diseases. Mutat Res–Rev Mutat. 2002;512:135–53. doi: 10.1016/s1383-5742(02)00046-7. [DOI] [PubMed] [Google Scholar]
- 40.Cox AG, Winterbourn CC, Hampton MB. Mitochondrial peroxiredoxin involvement in antioxidant defence and redox signalling. Biochem J. 2010;425:313–25. doi: 10.1042/BJ20091541. [DOI] [PubMed] [Google Scholar]
- 41.Oyedotun KS, Lemire BD. The quaternary structure of the Saccharomyces cerevisiae succinate dehydrogenase–homology modeling, cofactor docking, and molecular dynamics simulation studies. J Biol Chem. 2004;279:9424–31. doi: 10.1074/jbc.M311876200. [DOI] [PubMed] [Google Scholar]
- 42.Hsu C-P, Oka S, Shao D, et al. Nicotinamide phosphoribosyltransferase regulates cell survival through NAD(+) Synthesis in cardiac myocytes. Circ Res. 2009;105(481–U193) doi: 10.1161/CIRCRESAHA.109.203703. [DOI] [PMC free article] [PubMed] [Google Scholar]
- 43.Lund A, Knudsen SM, Vissing H, et al. Assignment of human elongation factor 1α genes: EEF1A maps to chromosome 6q14 and EEF1A2 to 20q13.3. Genomics. 1996;36:359–61. doi: 10.1006/geno.1996.0475. [DOI] [PubMed] [Google Scholar]
- 44.Leclercq TM, Moretti PAB, Pitson SM. Guanine nucleotides regulate sphingosine kinase 1 activation by eukaryotic elongation factor 1A and provide a mechanism for eEF1A-associated oncogenesis. Oncogene. 2011;30:372–8. doi: 10.1038/onc.2010.420. [DOI] [PubMed] [Google Scholar]
- 45.Kobayashi Y, Yonehara S. Novel cell death by downregulation of eEF1A1 expression in tetraploids. Cell Death Differ. 2008;16:139–50. doi: 10.1038/cdd.2008.136. [DOI] [PubMed] [Google Scholar]
- 46.Emili A, Shales M, McCracken S, et al. Splicing and transcription-associated proteins PSF and p54nrb/nonO bind to the RNA polymerase II CTD. RNA. 2002;8:1102–11. doi: 10.1017/s1355838202025037. [DOI] [PMC free article] [PubMed] [Google Scholar]
- 47.Lowery LA, Rubin J, Sive H. Whitesnake/sfpq Is required for cell survival and neuronal development in the zebrafish. Dev Dyn. 2007;236:1347–57. doi: 10.1002/dvdy.21132. [DOI] [PubMed] [Google Scholar]
- 48.Hao L, El Shamy WM. BRCA1-IRIS activates cyclin D1 expression in breast cancer cells by downregulating the JNK phosphatase DUSP3/VHR. Int J Cancer. 2007;121:39–46. doi: 10.1002/ijc.22597. [DOI] [PubMed] [Google Scholar]
Associated Data
This section collects any data citations, data availability statements, or supplementary materials included in this article.


