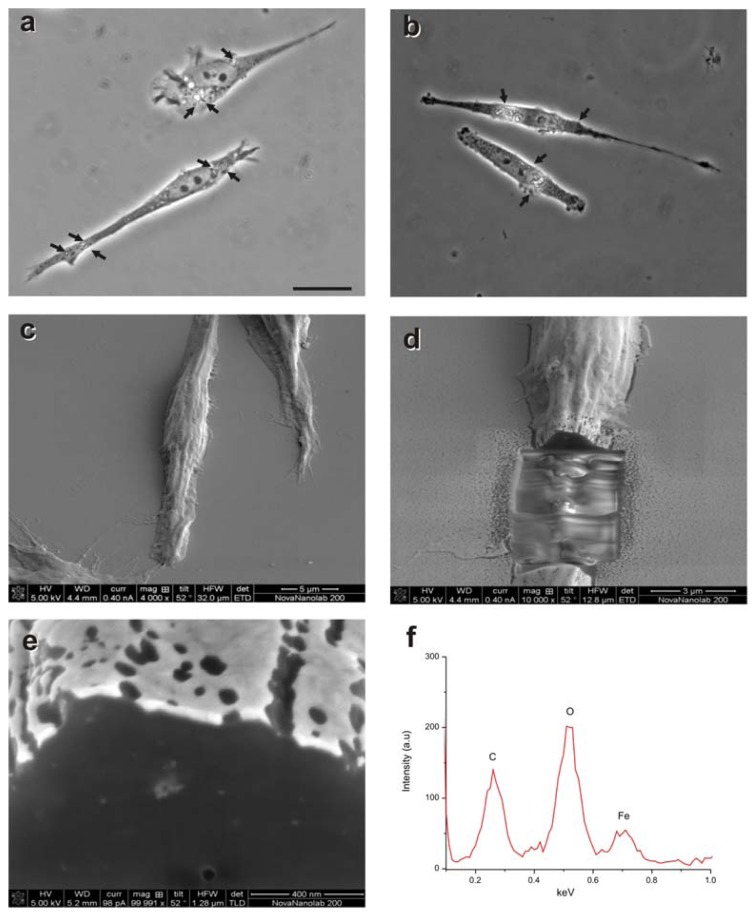
Figure 1.
(a,b) Light microscopy photomicrographs of olfactory ensheathing cells (OECs) treated with 10 μg/mL (a) or 25 μg/mL (b) of MNPs (M-OECs) (arrows in a and b); (c,d) dual beam SEM/FIB images of M-OECs treated with 10 μg/mL of MNPs. The internalization of the MNPs can be seen in the cross section of single OEC cells (light grey spots in e) and confirmed by the Fe-content from EDS analysis of these areas (spectral analysis in f).

