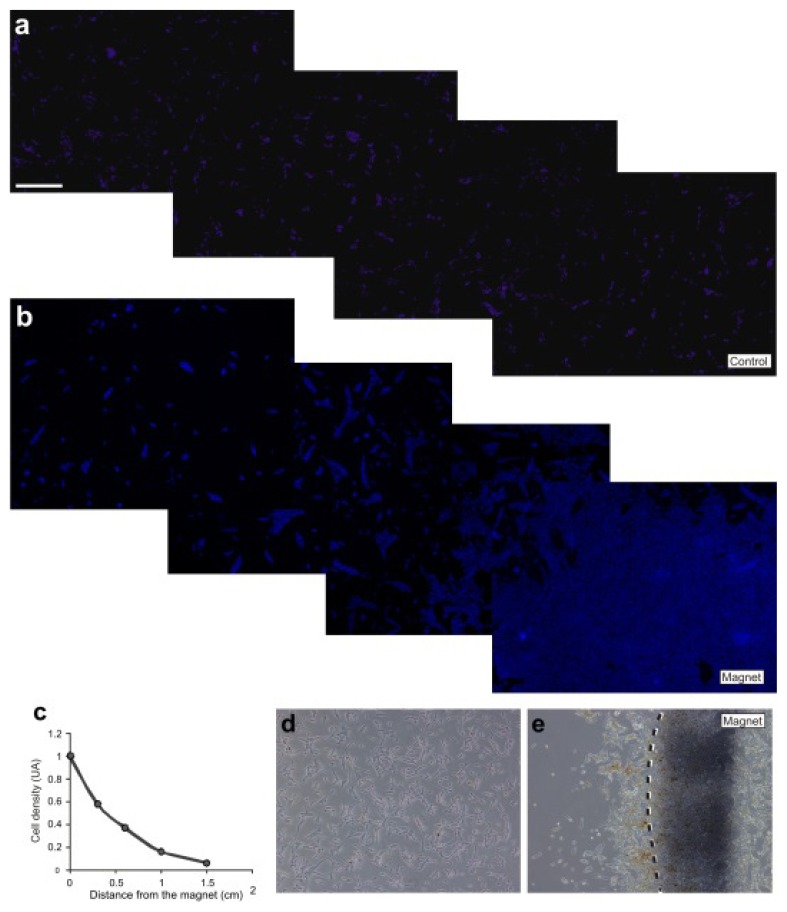
Figure 4.
(a) Hoechst staining of M-OECs treated with MNPs (10 μg/mL); (b) Hoechst staining of M-OECs treated with MNPs (10 μg/mL); 8 h after the seeding, the magnet was placed inside the 3,5 mm ø petri dish for 12 h, when the images were acquired. (c) Quantification of cell density (y-axis) vs. distance from the magnet (x-axis) in the experiments. Note the increased number of M-OECs close to the magnet. (d,e) White field of a and b, respectively.

