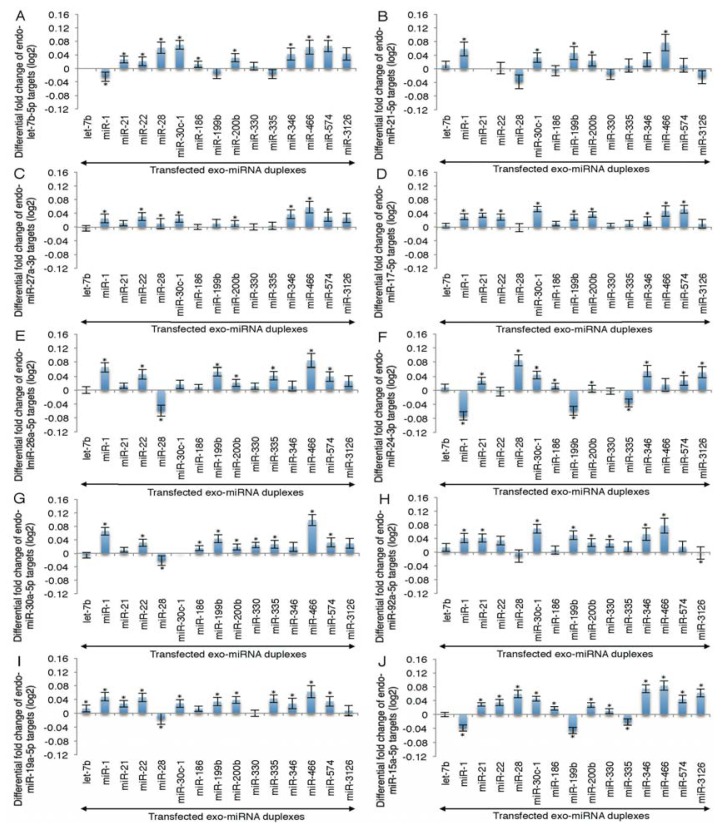
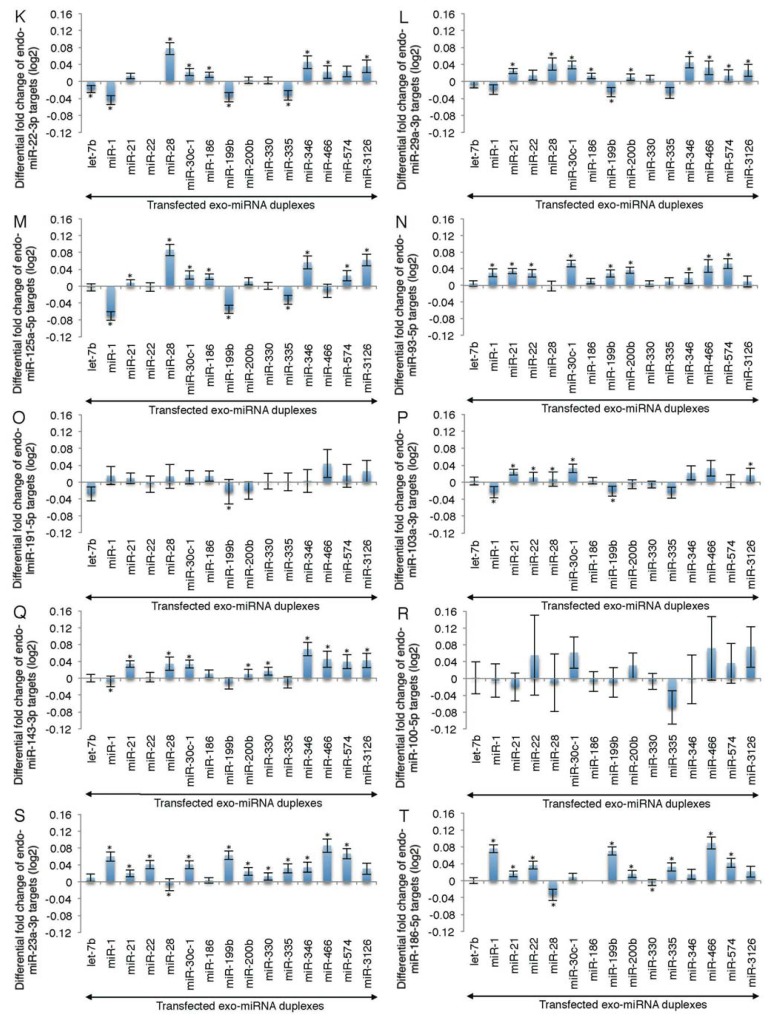
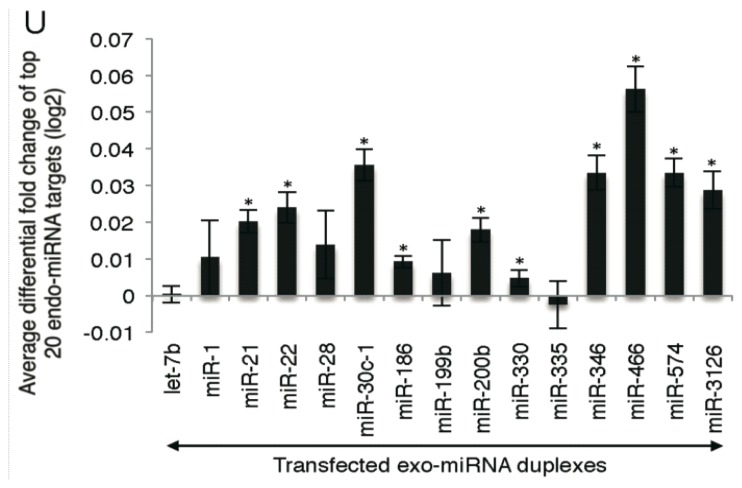
Figure 2.
Mean fold changes of the expression levels of endo-miRNA target transcripts by the transfection of different exo-miRNAs. HeLa cells were transfected with each of fifteen exo-miRNA duplexes, log2 mean differential fold changes of the expression levels of seed-matched target genes of each of the top 20 endo-miRNAs were calculated. Data were shown with respect to endo-miRNAs, let-7b-5p (A); miR-21 (B); mR-27a-3p (C); miR-17-5p (D); miR-26a-5p (E); miR-24-3p (F); miR-30a-5p (G); miR-92a-5p (H); miR-19a-5p (I); miR-15a-5p (J); miR-22-3p (K); miR-29a-3p (L); miR-125a-5p (M); miR-93-5p (N); miR-191-5p (O); miR-103a-3p (P); miR-143-3p (Q); miR-100-5p (R); miR-23a-3p (S); and mR-186-5p (T); and their averaged values were shown in (U). Note that each exo-miRNA increased the endo-miRNA target genes in different degrees. The individual data are shown in Figures S2–S21. Data represent the mean ± SE (*p < 0.05).


