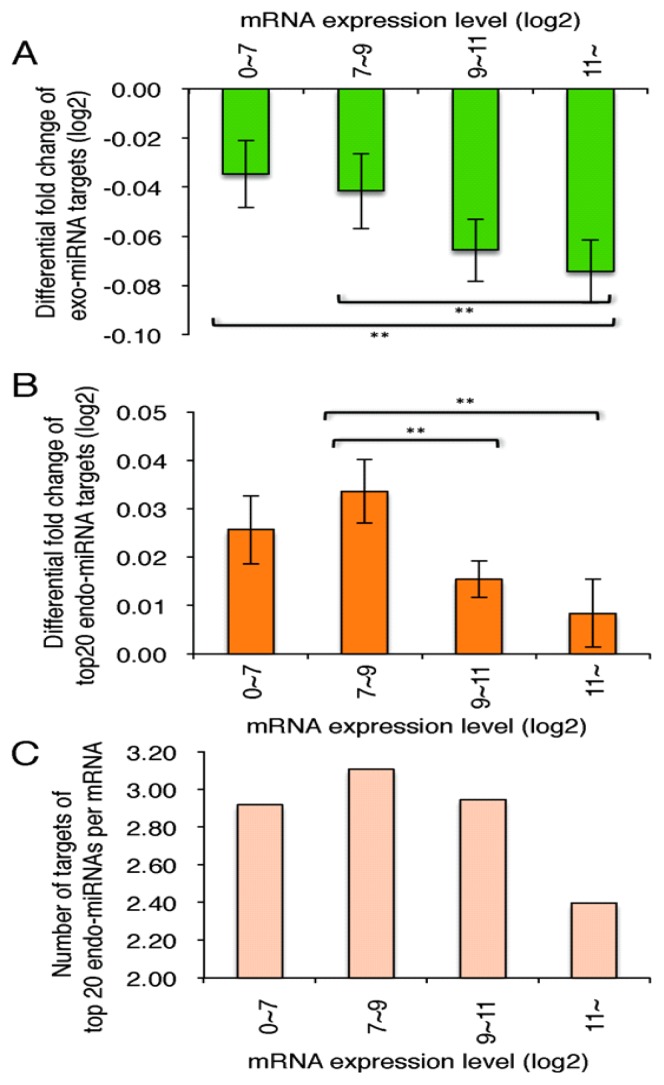
Figure 6.
Mean fold changes of target genes of exo-miRNAs and endo-miRNAs, according to the expression levels. Differential fold changes (log2) of target gene expression levels of exo-miRNAs (A) and endo-miRNAs (B) and the number of the top 20 endo-miRNA target sites (C), according to the expression levels of exo-miRNA targets. The averaged numbers of exo-miRNA target sites are 130, 217, 237 and 215 (A), and those of endo-miRNA target sites are 92, 164, 176 and 202 (B) in the 3′ UTRs of genes with differential fold changes of 0~7, 7~9, 9~11 and 11~.

