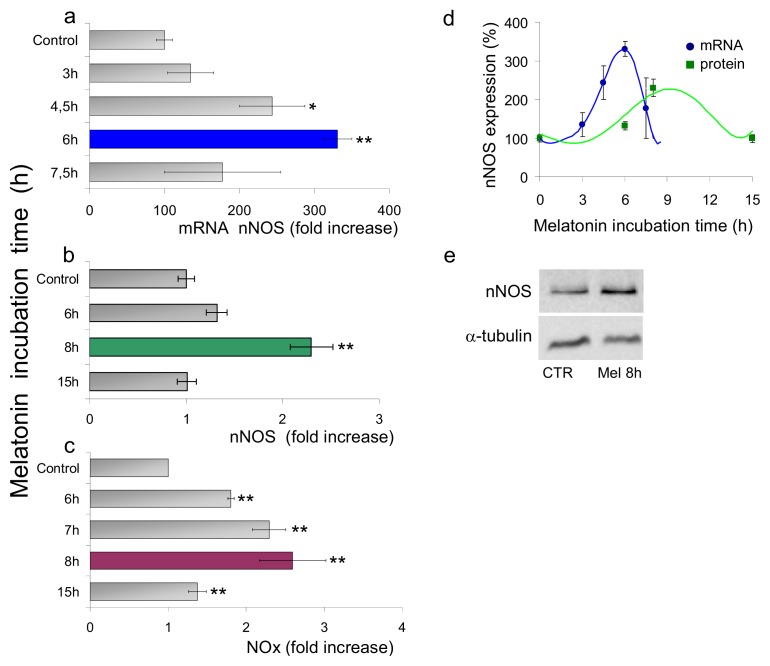
Figure 2.
Time-dependent effects of nM melatonin on nNOS expression and NOx production. HaCaT cells were incubated with 1 nM melatonin; at the times indicated, the nNOS mRNA (a), nNOS protein (b) and nitrite/nitrate (NOx) production (c) were assayed. (a) QRT-PCR analysis of mRNA expression was performed in the presence of specific primers for nNOS. The relative expression levels were calculated vs. untreated controls (ß-actin normalized). The maximal mRNA expression at 6 h (blue). Data +/− SEM, n ≥ 3. **p ≤ 0.01 vs. control; *p ≤ 0.05 vs. control; (b) Western blot analysis of nNOS protein. Data shown as fold increase vs. the nNOS protein expressed by control cells, as a function of incubation time. The maximal protein synthesis at 8 h (green). Data +/− SEM, n ≥ 3. **p ≤ 0.01 vs. control; (c) NOx accumulation measured in the supernatant as a function of time. Data shown as fold increase vs. control (untreated). The maximal NOx production at 8 h (violet). Data +/− SEM, n ≥ 5. **p ≤ 0.01 vs. control; (d) Time-dependent profile of the expression of the nNOS mRNA (blue) and nNOS protein (green); (e) Western Blot of cells incubated 8 h with 1 nM melatonin and controls (CTR); α-tubulin as reference.

