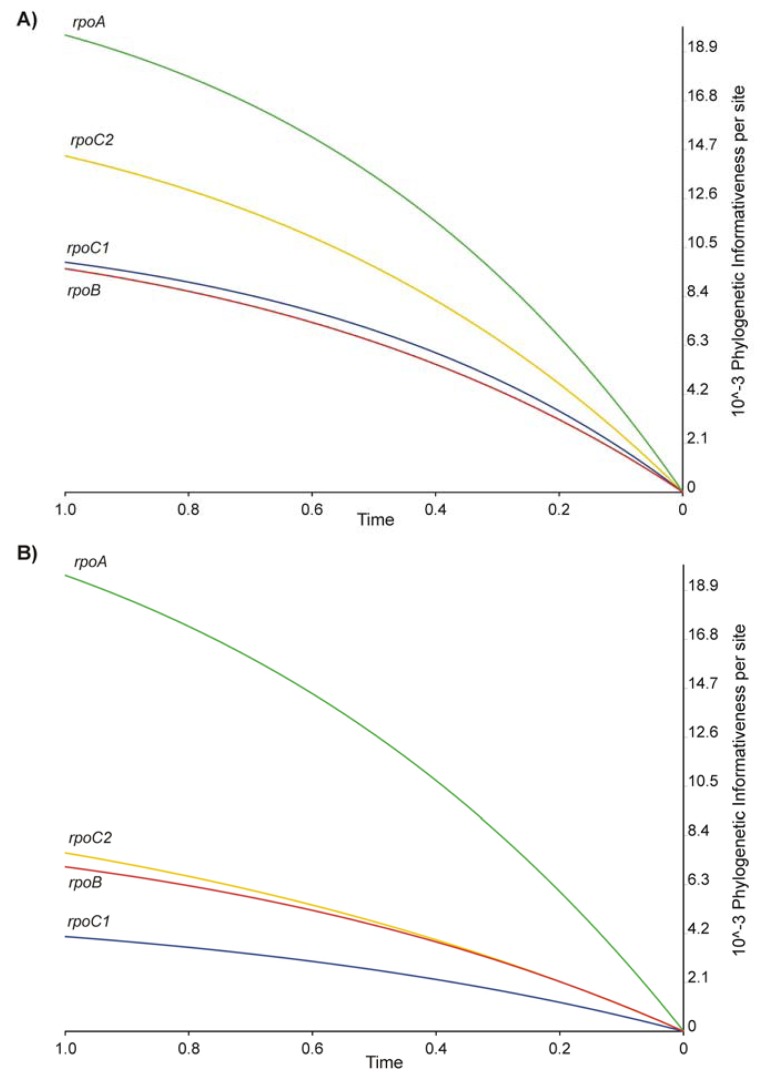
Figure 4.
Profile of phylogenetic informativeness for rpo genes per site calculated from (A) the nucleotide and (B) the amino acids sequences (rpoA—green, rpoB—red, rpoC1—blue, rpoC2—yellow). The time axis is calibrated in relation to the ultrametrisized ML tree derived from the dataset of four rpo genes. An evolutionary time of 1.0 corresponds to the root of the tree and the value of 0 to its tips.

