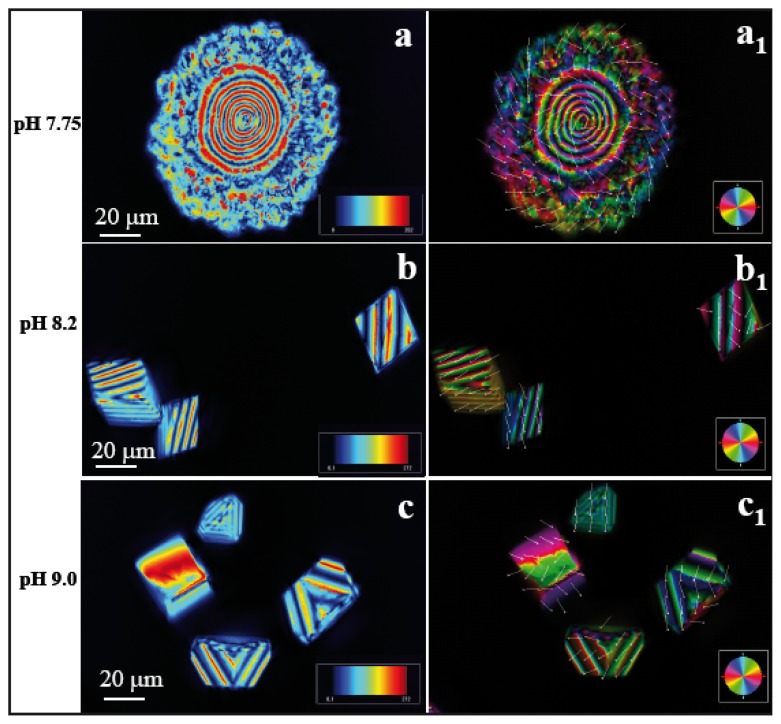
Figure 3.
LC-PolScope images of CaCO3 crystals grown in presence of peptide AS8 (pI 10.6) at pH 7.75, pH 8.2, and pH 9.0, respectively, in the quantitative birefringence mode showing the retardance and orientation images. Scale bar: 20 μm. The experiment shows a smooth transition from polycrystalline to single crystal morphology obtained by changing the pH value. (a,a1) Peptide AS8 at pH 7.75, c = 9.66 mM; (b,b1) Peptide AS8 at pH 8.2, c = 9.09 mM; (c,c1) Peptide AS8 at pH 9.0, c = 6.13 mM.

