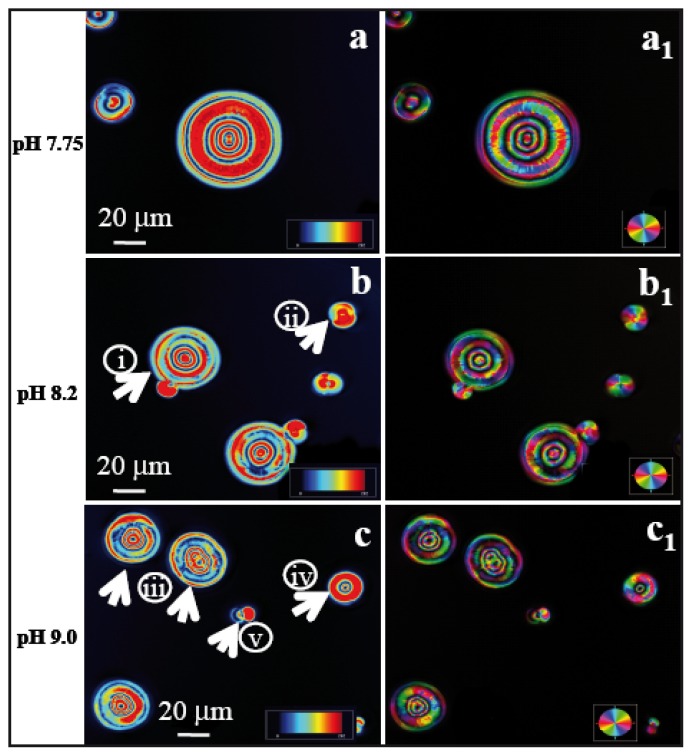
Figure 4.
LC-PolScope images of CaCO3 crystals grown in presence of peptide ES9 (pI 9.41) at pH 7.75, pH 8.2, and pH 9.0. Birefringence data show the retardance and orientation images left and right, respectively. Scale bar: 20 μm. (a,a1) Peptide ES9 at pH 7.75, c = 10 mM; (b,b1) Peptide ES9 at pH 8.2, c = 10 mM; (c,c1) Peptide ES9 at pH 9.0, c = 10 mM. The numbers in figures (b) (i, ii) and (c) (iii–v) indicate the different morphologies of CaCO3 crystals. Note that the outer ring of polycrystals shows retardance values in the blue range (arrows).

